General concepts
The Interactive Visualization and Analysis library is the component of JEODPP infrastructure that allows users to visually browse the image collections available and to perform analysis using the processing operators defined.
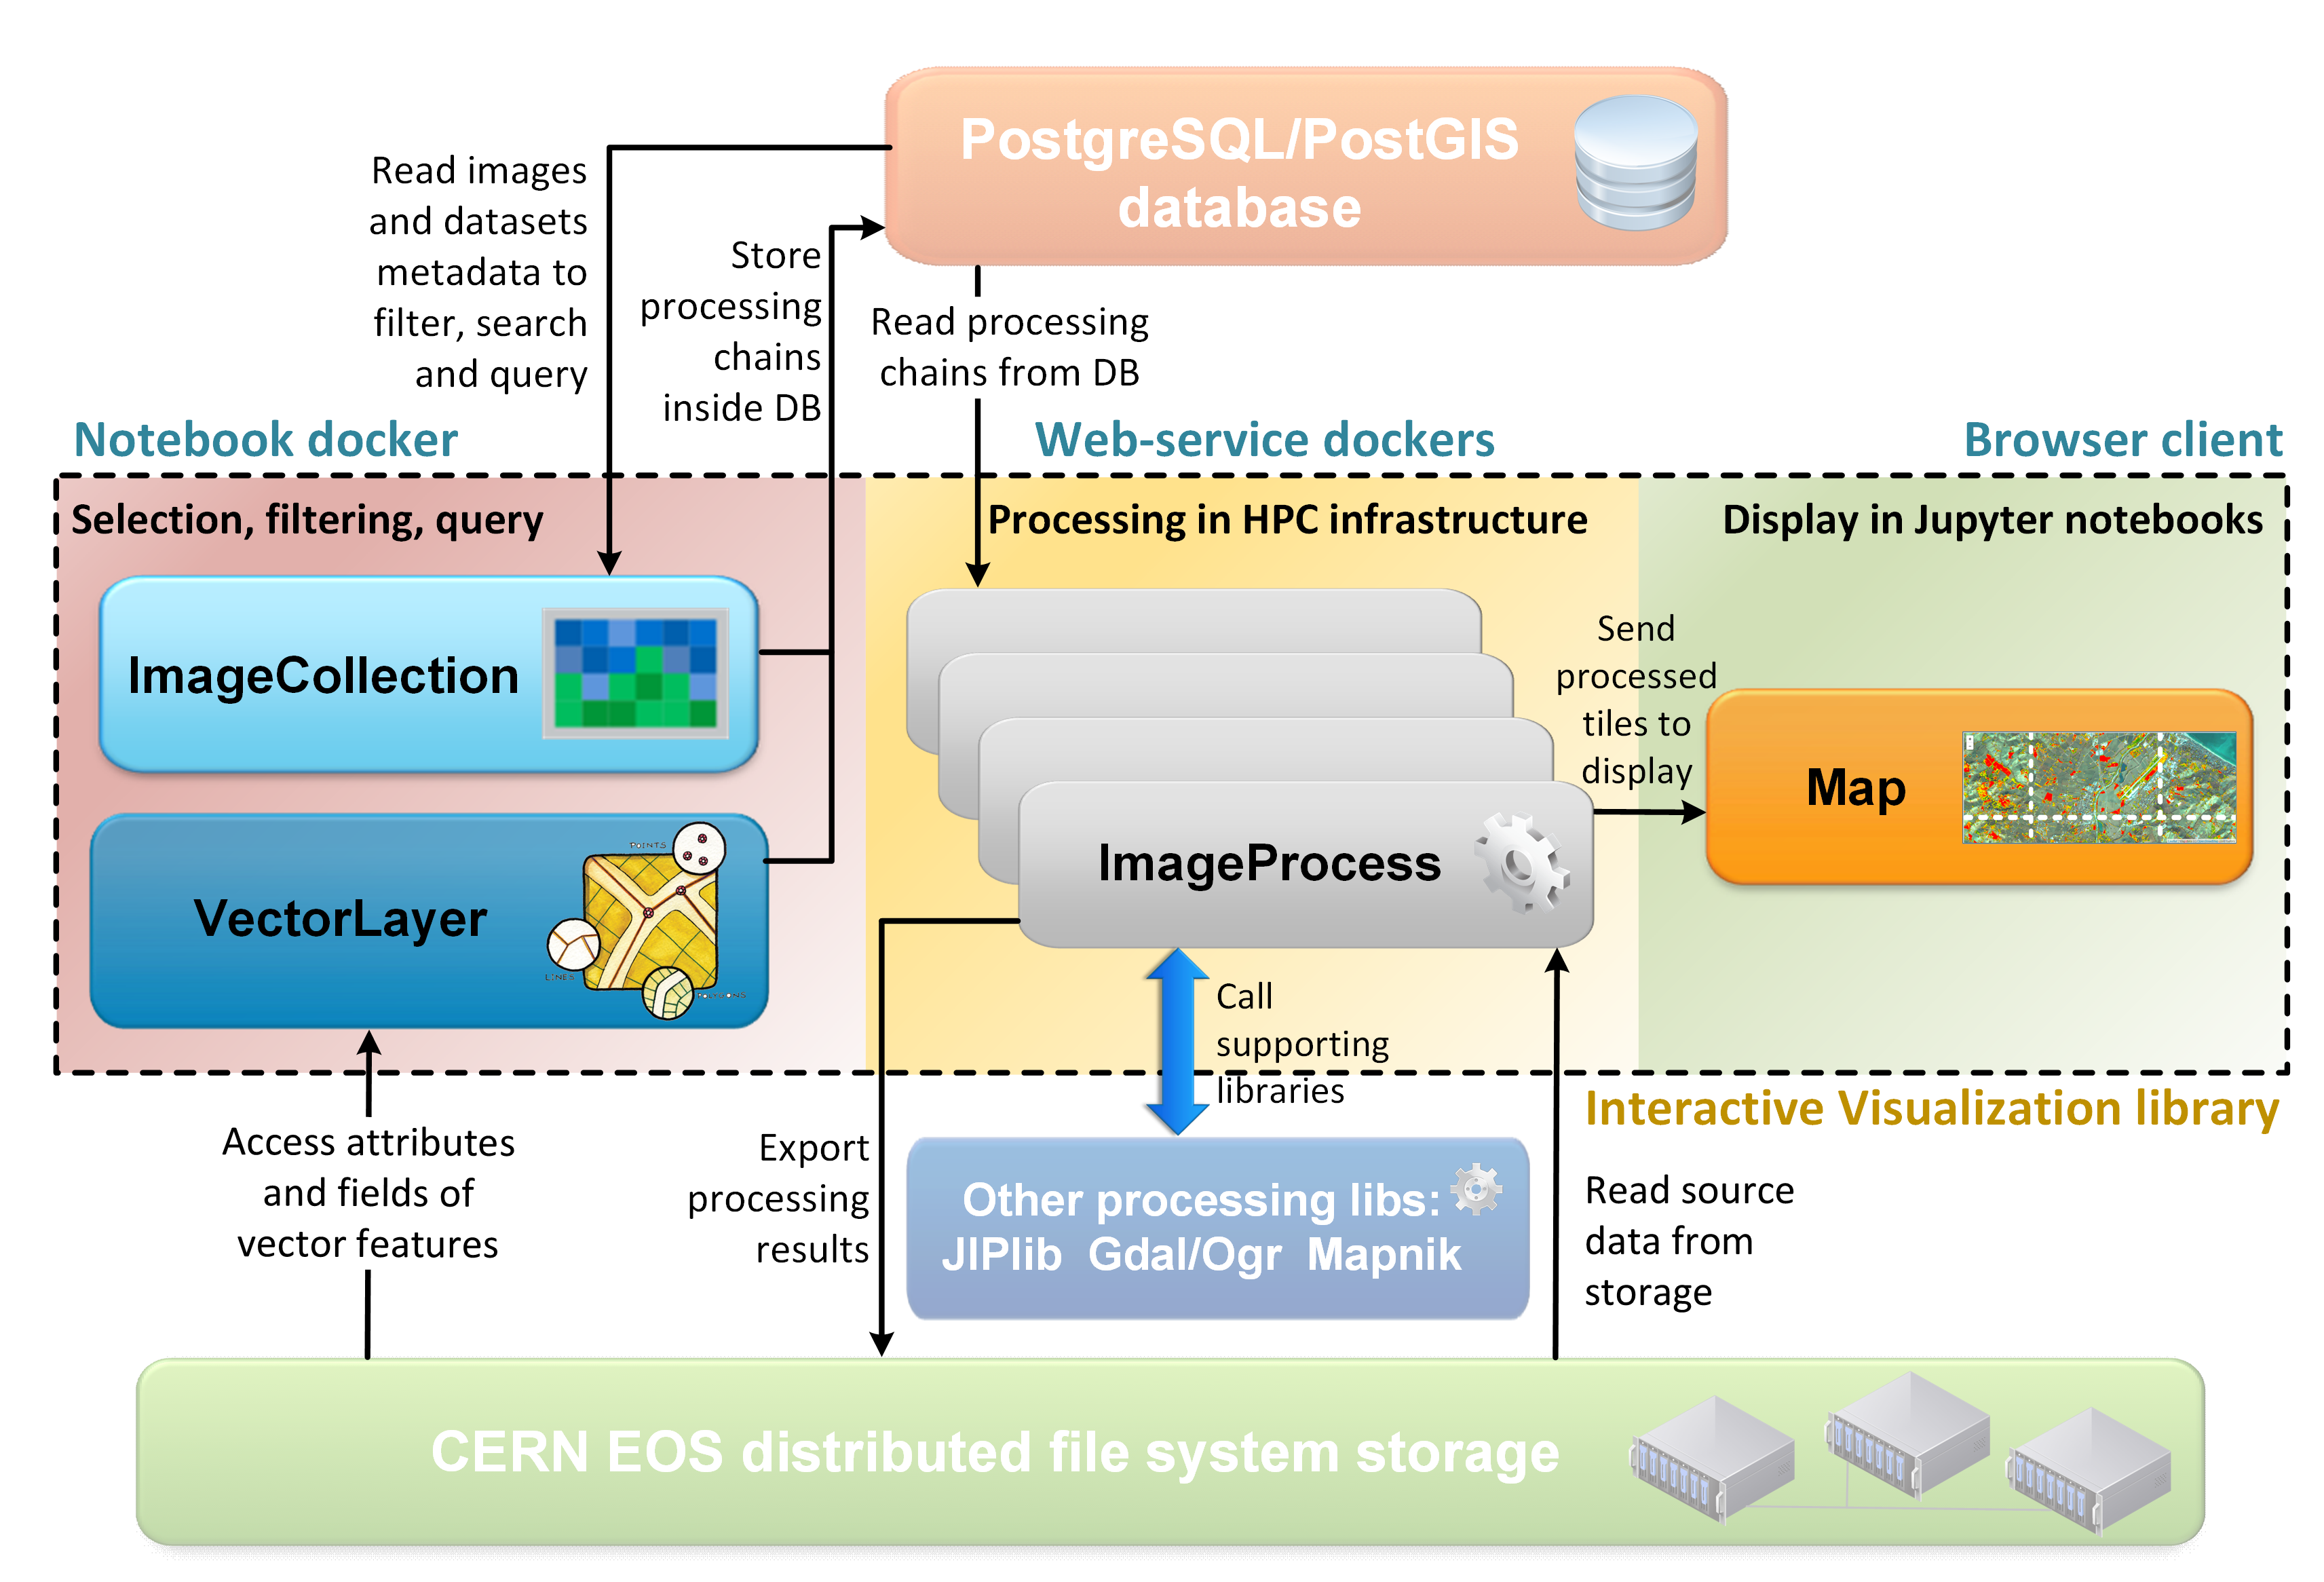
The main components of the library are the following software classes:
- Map:
- its aim is to visualize raster and vector data layers in an interactive environment that allows pan and zoom. See reference manual:
Map. - ImageCollection:
- is the class to use to select the raster data collection to browse and filter based on geographic location and metadata attributes. See reference manual:
ImageCollection. - ImageProcess:
- is a software representation of a processing chain (a series of processing operator applied to source data to perform a specific analysis). See reference manual:
ImageProcess. - VectorLayer:
- is the class to use to display and process vector data present in the JEODPP infrastructure as well as vector data uploaded by the users. See reference manual:
VectorLayer.
The relationships among the four main classes provided by the library are graphically depicted in the following image:
To simplify collections discovery and selection, the function Collection() can be called by passing the path descriptor of the collection:
coll = Collections(collections.EarthObservation.Copernicus.Sentinel2)
In case the path descriptor identifies a raster data collection, an instance of ImageCollection class is returned.
In case the path descriptor identifies a vector data collection, an instance of VectorLayer class is returned.
All the path descriptors are grouped on a tree structure under the global variable “collections”. Using the python auto-complete feature, it is possible to write “collections.” and then type the <TAB> key to get the list of all available completions and repeat the <TAB> key auto-completion until the desider collection is selected.
In the following chapters all methods of the four classes are described.