VectorLayer class
-
class
inter.VectorLayer¶ VectorLayer class defines a vector dataset layer. An instance of VectorLayer has to be created by giving as argument the name of the dataset. To list all the available vector datasets the following call should be executed:
inter.listVectorLayers()
The VectorLayer object can be queried to extract information on layers (datasets present inside the map), the styles (definition of how a layer has to be displayed) and the rules (filter of dataset features to be displayed with specific symbology). The relation between these concepts is always a
one-to-manyrelation: it means that a VectorLayer can have one on more layers, a layer can be displayed using one or more styles, a style can include one or more rules.Inside a rule, one or more
Symbolizercan be present (for instance a LineSymbolizer, a PolygonSymbolizer, etc.). Every symbolizer has a series of attributes that can be inspected or modified by calling methodsVectorLayer.get()orVectorLayer.set().- Examples:
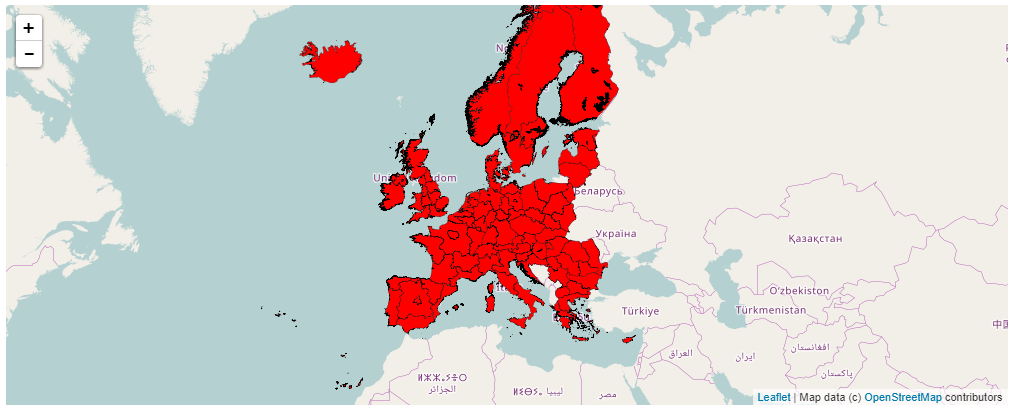
Creation of a VectorLayer on dataset nuts1 (Nomenclature of Territorial Units for Statistics):
v = inter.VectorLayer("nuts1").opacity(255)
map.addLayer(v.toLayer())
A more complex example: create the VectorLayer object from the nuts1 data, remove all symbology rules, add a rule to display a single country:
v = inter.VectorLayer("nuts1").opacity(128)
v.remove('default','all')
country = "[ICC] = 'DE'"
v.set('default',country,'poly','fill','#ff000055')
Then create an ImageProcess instance from the Core003 dataset, convert the VectorLayer to an ImageProcess object and mask the raster instance with the vector layer to display Core003 only over Germany:
p03 = inter.ImageCollection("C03").process()
pv = v.process()
p03 = p03.mask(pv)
map.addLayer(p03.toLayer())
General methods
-
VectorLayer.getDebug()¶ Queries the current state of the Debug flag
- Returns:
- True if Debug state is active, False otherwise.
-
VectorLayer.setDebug(flag)¶ Sets the Debug flag. When the Debug flag is set the VectorLayer class prints various information to the output of the ipython notebook. It can be useful to debug possible problems encountered in vector dataset customization.
- Args:
flag(bool): True if the Debug state has to be activated, False if it has to be deactivated.
-
VectorLayer.copyTo(layer)¶ Copies the content of a VectorLayer instance to another instance.
- Args:
layer(VectorLayer): Destination instance of VectorLayer copyTo operation
-
VectorLayer.parameter(Name, Value)¶ Sets the value for a parameter of the VectorLayer object.
- Args:
Name(string): Name of the parameter.Value(string): value to assign to the parameter.
- Returns:
- A reference to the modified instance of
VectorLayer(so that this method can be chained with other methods using the . syntax). - Notes:
Here is the list of parameters implemented by the VectorLayer objects:
identifyvalues can beallorfirst. It controls if the identify operation (seeVectorLayer.identifyPoint()) will return all features or only the first one (default=first).identifyFieldvalues can be the empty string or a list of names of attributes of the vector layer (separated by blank character). In the first case, the identify operation returns all the attribute names and values of the selected features. If one or more names of attributes are given, then the identify operation will return only the values of those attributes separated with the “identifySeparator” if more than one feature is selected (default=empty string).identifySeparatorseparator to put between values when the identify returns value on a single field, i.e. when identifyField is not empty (default=”#”).identifyFilterfilter on attributes to limit the features to identify. It can be a clause likeAttributeName = value(default=empty string).identifySortFieldname of the attribute to use to sort the identify results. It can be the empty string or the name of an attribute. In this second case, the results of an identify will be sorted in ascending mode on the values of the selected attribute (default=empty string).
Example:
Create a VectorLayer from the Burnt Area dataset:
v = inter.VectorLayer("BurntAreas")
Set values for all the identify parameters and select 5 attributes of the dataset to be identified:
year_clause = "YearSeason = 2016"

v.parameter("Identify","all")
v.parameter("IdentifyFilter",year_clause)
v.parameter("IdentifyField","FireDate Place_Name Province Country Area_HA")
v.parameter("IdentifySeparator","#")
v.parameter("IdentifySortField","FireDate")
Call
VectorLayer.identifyPoint()for a specific location in Portugal and display the returned string:values = v.identifyPoint(-8.14636230469,41.1290213475,4326,8) values = unicode(values, encoding="utf-8", errors="ignore") print values
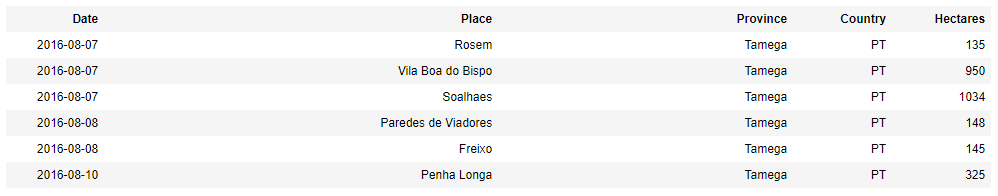
Convert the list of values into an HTML table:
from IPython.core.display import display, HTML
valueslist = values.split('#')
if len(valueslist) > 4:
    html = '<table style="width:100%"> <tr> <th>Date</th> <th style="width:40%">Place</th>'
    html += '<th style="width:30%">Province</th> <th>Country</th> <th>Hectares</th> </tr>'
    for i in range(0,len(valueslist),5):
        html += '<tr>'
        for j in range(i,i+5):
            html += '<td>' + valueslist[j] + '</td>'
        html += '</tr>'
    html += '</table>'
    display(HTML(html))
Table produced by the example code above:
-
VectorLayer.opacity(Value)¶ Sets the opacity value to be used for the display of the VectorLayer as a layer into the Map instance.
- Args:
Value(integer): Opacity to use for display from 0 = transparent to 255 = opaque (default = 255).
- Returns:
- A reference to the modified instance of
VectorLayer(so that this method can be chained with other methods using the . syntax).
-
VectorLayer.identifyPoint(Longitude, Latitude, EPSG, ZoomLevel)¶ Given in input a point in a specific SRS, the method returns a string containing the values read from the VectorLayer instance in correspondance to that geographic location.
- Args:
Longitude(float): Longitude of the query point.Latitude(float): Latitude of the query point.EPSG(integer): EPSG of the coordinate system in which the longitude and latitude coordinate are given.ZoomLevel(integer): zoom level in the range [1,18] (defines the tolerance for searching vector features).
- Returns:
- A string containing information found at the specified geographic location inside the vector dataset (names and values of fields for the features found on the geographic location).
-
VectorLayer.search(Query)¶ Search features of VectorLayer that satisfy a given query. The query can be written using expression made up from the field names of the vector dataset.
- Args:
Query(string): Filter query to select a subset of the feature of the vector dataset. See the Examples session below.
- Returns:
- A list containing [CenterLat CenterLon ZoomLevel]
- Example:
Typical usage of the search function is to pass the returned value to the
Map.zoomToExtent()method, as showed in the following pieces of code:Zoom to a specific tile of the MGRS grid:
map = Map()
v = inter.VectorLayer("mgrs")
map.zoomToExtent(v.search("Name = '33TUH'"))
map
Zoom to a UTM zone using the MGRS grid:
map = Map()
v = inter.VectorLayer("mgrs")
map.zoomToExtent(v.search("Name LIKE '12T%'"))
map
-
VectorLayer.process()¶ Creates an instance of
ImageProcessfrom the vectorLayer. The created object can be used to perform processing operations (like mask, combine, filter, etc.) and then visualize it adding a new layer to the Map.- Returns:
- An instance of an
ImageProcessclass that contains the features selected and customized by the VectorLayer object
-
VectorLayer.printLayer()¶ Prints to the output of the notebook a detailed description of the VectorLayer showing all data members of the instance.
-
VectorLayer.toLayer()¶ Saves the VectorLayer object to the server side processing chain DB and returns a string containing the unique ID of the processing chain itself. Passing the returned value to the
Map.addLayer()method will add a layer to the map to display the vector dataset.Example:
Create a map instance:
map = Map()
map
Create a VectorLayer object from the mgrs dataset (Military Grid Reference System, the grid used by ESA for the Sentinel products tiles) and add it as a new layer to the map:
v = inter.VectorLayer("mgrs")
map.addLayer(v.toLayer())
- Returns:
- A string containing the unique ID of the processing chain derived from the VectorLayer object.
Get information on layers, style, rules
-
VectorLayer.layers()¶ A VectorLayer object represents a vector dataset. Inside the dataset, one or more data layers can be present. This method returns a list of the names of all the datasets inside the VectorLayer instance.
- Returns:
- A list containing the names of all the layers inside the VectorLayer object.
Example:
Create a VectorLayer from nuts1 dataset and print the names of the layers present in it:
v = inter.VectorLayer("nuts1")
print v.layers()
-
VectorLayer.mainlayer()¶ Among the layers of a vector dataset, the first one is considered the
mainlayer. Many functions of the VectorLayer class have a simplified version that operates on the main layer.- Returns:
- The name of the main layer of the vector dataset.
-
VectorLayer.mainstyle()¶ Any layer of a vector dataset can be displayed using one or more styles. This method returns the name of the first style associated with the main layer of the VectorLayer instance.
- Returns:
- The name of the first style of the main layer of the dataset.
-
VectorLayer.styles(*args)¶ Returns a list of names of styles present in the vector dataset. If the method is called passing as argument a name of a layer, the returned list will contain only the styles of that layer. If the method is called without any argument, then the list of all styles is returned.
- Args:
LayerName(string): A name of a layer (optional).
- Returns:
- A list containing names of styles.
Example:
Create a VectorLayer from nuts1 dataset and print the names of the styles of the nuts1 layer:
v = inter.VectorLayer("nuts1")
print v.styles('nuts1')
-
VectorLayer.style(*args)¶ Returns the name of the first style of a layer.
- Args:
LayerName(string): A name of a layer.
- Returns:
- The name of the first style for the layer whose name is passed as argument.
-
VectorLayer.rules(*args)¶ Returns a list of names of rules present in a style.
- Args:
StyleName(string): A name of a style.
- Returns:
- A list containing names of rules.
Example:
Create a VectorLayer from nuts1 dataset and print the names of the rules of the default style:
v = inter.VectorLayer("nuts1")
print v.rules('default')
-
VectorLayer.get(*args)¶ Returns the value of an attribute of a symbolizer. Inside a rule, one or more
Symbolizercan be present (for instance a LineSymbolizer, a PolygonSymbolizer, etc.). Every symbolizer has a series of attributes that can be inspected calling get method.- Args:
This method can be called in different ways, depending on what rule has to be inspected:
Getting information on a rule giving the name of the style and the name of the rule:
styleName(string): name of the style.ruleName(string): name of the rule.symbolizerName(string): name of the symbolizer.attributeName(string): name of the attribute.
Getting information on a rule of the
Defaultstyle:ruleName(string): name of the rule.symbolizerName(string): name of the symbolizer.attributeName(string): name of the attribute.
Getting information on the rule regarding all features of the
Defaultstyle:symbolizerName(string): name of the symbolizer.attributeName(string): name of the attribute.
- Notes:
The most important attribute names available for each of the symbolizers are:
PolygonSymbolizer (see MapnikPolygon for a complete list):
fill(#RRGGBBAA or #RRGGBB): fill color of the polygons.fill-opacity(float in [0.0,1.0]): opacity of the fill, from 0.0=transparent to 1.0=completely opaque.
LineSymbolizer (see MapnikLine for a complete list):
stroke(#RRGGBBAA or #RRGGBB): color of lines.stroke-width(float): line width in pixels.stroke-opacity(float in [0.0,1.0]): opacity of the line, from 0.0=transparent to 1.0=completely opaque.
TextSymbolizer (see MapnikText for a complete list):
face-name(string): name of the font (for instance: ‘DejaVu Sans Book).placement(string as ‘line’, ‘point’, etc.): type of feature where to put text labels.size(float): dimension of text.fill(#RRGGBBAA or #RRGGBB): color of text.halo-fill(#RRGGBBAA or #RRGGBB): color of halo to add to text label (if halo-radius is greater than 0).halo-radius(float): dimension of halo around text labels.allow-overlap(‘true’ or ‘false’): allow labels to overlap other labels.
MarkersSymbolizer (see MapnikMarker for a complete list):
fill(#RRGGBBAA or #RRGGBB): color of symbol for points.width(float): dimension of symbol in x direction.height(float): dimension of symbol in y direction.stroke(#RRGGBBAA or #RRGGBB): color of the border of symbol.stroke-width(float): line width in pixels.placement(string as ‘line’, ‘point’, etc.): type of feature where to put text labels.marker-type(string as ‘ellipse’, ‘arrow’, etc.): type of symbol to use.
The names of the rule that filters all the features of a dataset is, by default,
all. So these three pieces of code have the same effect:v.get('default', 'all', 'LineSymbolizer', 'stroke-width') v.get('all', 'LineSymbolizer', 'stroke-width') v.get('LineSymbolizer', 'stroke-width')
They all return the width of the line for the rule applied to all features of the default style.
The names of symbolizers can be simplified using these alias:
polygonorpolycan be use instead of “PolygonSymbolizer”linecan be use instead of “LineSymbolizer”textcan be use instead of “TextSymbolizer”pointcan be use instead of “MarkersSymbolizer”
- Returns:
- A string containing the value of the attribute of the symbolizer.
Example:
Create a VectorLayer from nuts1 dataset and print the fill color used to display the layer:
v = inter.VectorLayer("nuts1")
print v.get('default','all','poly','fill')
Modify rules to change display properties
-
VectorLayer.reset()¶ Resets all modifications done to the style rules. After a call to this method, the display properties of the VectorLayer instance are set back to the original version.
-
VectorLayer.set(*args)¶ Modifies the value of an attribute of a symbolizer. Inside a rule, one or more
Symbolizercan be present (for instance a LineSymbolizer, a PolygonSymbolizer, etc.). Every symbolizer has a series of attributes that can be inspected calling get method. Refer to theVectorLayer.get()description to obtain information about style names, rule names, symbolizer names and attribute names.- Args:
This method can be called in different ways, depending on what rule has to be inspected:
Modifing a rule giving the name of the style and the name of the rule:
styleName(string): name of the style.ruleName(string): name of the rule.symbolizerName(string): name of the symbolizer.attributeName(string): name of the attribute.value(string): value to assign to the attribute.
Modifing a rule of the
Defaultstyle:ruleName(string): name of the rule.symbolizerName(string): name of the symbolizer.attributeName(string): name of the attribute.value(string): value to assign to the attribute.
Modifing a rule regarding all features of the
Defaultstyle:symbolizerName(string): name of the symbolizer.attributeName(string): name of the attribute.value(string): value to assign to the attribute.
- Example:
Create a VectorLayer from nuts1 dataset and change the fill color used to display the layer to a completely opaque red:
v = inter.VectorLayer("nuts1")
v.set('default','all','poly','fill', '#ff0000')
-
VectorLayer.remove(*args)¶ Removes a rule from a style.
- Args:
This method can be called in different ways, depending on what rule has to be removed:
Removing a rule giving the name of the style and the name of the rule:
styleName(string): name of the style.ruleName(string): name of the rule.
Removing a rule of the
Defaultstyle:ruleName(string): name of the rule.
- Example:
Create a VectorLayer from nuts1 dataset:
v = inter.VectorLayer("nuts1")
Remove the rule that displays all polygons:
v.remove('default','all')
Add a new rule that displays only the polygons of Germany in transparent red:
country = "[ICC] = 'DE'"
v.set('default',country,'poly','fill','#ff000055')
-
VectorLayer.printXML()¶ Prints the complete description of the VectorLayer in XML format. It is a way to debug the result of calls to
VectorLayer.set()orVectorLayer.remove()in order to check that they had the desired effect. The XML description is the one used by Mapnik sofware.
Information on data sources and fields
-
VectorLayer.datasourcefile(*args)¶ Returns the datasource file path for a layer given the layer name.
- Args:
This method can be called in different ways, depending on what layer has to be inspected:
Getting the datasource file path for a layer giving its name:
layerName(string): name of the layer.
Getting the datasource file path for the first layer of the dataset (see
VectorLayer.mainlayer()):- none.
- Returns:
- A string containing the file path.
-
VectorLayer.srs(*args)¶ Returns SRS (Spatial Reference System) for a layer given the layer name.
- Args:
This method can be called in different ways, depending on what layer has to be inspected:
Getting the SRS for a layer giving its name:
layerName(string): name of the layer.
Getting the SRS for the first layer of the dataset (see
VectorLayer.mainlayer()):- none.
- Returns:
- A string containing the SRS of the layer.
-
VectorLayer.geomtype(*args)¶ Returns the geometry type for a layer given the layer name.
- Args:
This method can be called in different ways, depending on what layer has to be inspected:
Getting the geometry type for a layer giving its name:
layerName(string): name of the layer.
Getting the geometry type for the first layer of the dataset (see
VectorLayer.mainlayer()):- none.
- Returns:
- A string containing the geometry type of the layer.
-
VectorLayer.symbolizer(*args)¶ Returns the name of the standard symbolizer for a layer given the layer name.
- Args:
This method can be called in different ways, depending on what layer has to be inspected:
Getting the name of the standard symbolizer for a layer giving its name:
layerName(string): name of the layer.
Getting the name of the standard symbolizer for the first layer of the dataset (see
VectorLayer.mainlayer()):- none.
- Returns:
- A string containing the name of the standard symbolizer of the layer.
-
VectorLayer.colorKeyName(*args)¶ Returns the name of the attribute that specifies symbol color for a layer given the layer name.
- Args:
This method can be called in different ways, depending on what layer has to be inspected:
Getting the name of the attribute that specifies symbol color for a layer giving its name:
layerName(string): name of the layer.
Getting the name of the attribute that specifies symbol color for the first layer of the dataset (see
VectorLayer.mainlayer()):- none.
- Returns:
- A string containing the name of the attribute that specifies symbol color of the layer.
-
VectorLayer.attributes(*args)¶ Returns the list of attribute names for a layer given the layer name.
- Args:
This method can be called in different ways, depending on what layer has to be inspected:
Getting the list of attribute names for a layer giving its name:
layerName(string): name of the layer.
Getting the list of attribute names for the first layer of the dataset (see
VectorLayer.mainlayer()):- none.
- Returns:
- A list of strings containing the attribute names of the layer.
-
VectorLayer.attribtypes(*args)¶ Returns the list of attribute types for a layer given the layer name.
- Args:
This method can be called in different ways, depending on what layer has to be inspected:
Getting the list of attribute types for a layer giving its name:
layerName(string): name of the layer.
Getting the list of attribute types for the first layer of the dataset (see
VectorLayer.mainlayer()):- none.
- Returns:
- A list of strings containing the attribute types of the layer.
-
VectorLayer.attribtype(*args)¶ Returns the attribute type for an attribute of layer given the layer name and the attribute name.
- Args:
This method can be called in different ways, depending on what layer has to be inspected:
Getting the attribute type for a layer giving its name and the attribute name:
layerName(string): name of the layer.attributeName(string): name of the attribute.
Getting the attribute type for an attribute of the first layer of the dataset (see
VectorLayer.mainlayer()):attributeName(string): name of the attribute.
- Returns:
- A string containing the attribute type.
-
VectorLayer.all(*args)¶ Returns the list of all values for an attribute of layer given the layer name and the attribute name.
- Args:
This method can be called in different ways, depending on what layer has to be inspected:
Getting the list of all values for a layer giving its name and the attribute name:
layerName(string): name of the layer.attributeName(string): name of the attribute.
Getting the list of all values for an attribute of the first layer of the dataset (see
VectorLayer.mainlayer()):attributeName(string): name of the attribute.
- Returns:
- A list of strings containing all the values of an attribute of a layer.
-
VectorLayer.distinct(*args)¶ Returns the list of all distinct values for an attribute of layer given the layer name and the attribute name.
- Args:
This method can be called in different ways, depending on what layer has to be inspected:
Getting the list of all distinct values for a layer giving its name and the attribute name:
layerName(string): name of the layer.attributeName(string): name of the attribute.
Getting the list of all distinct values for an attribute of the first layer of the dataset (see
VectorLayer.mainlayer()):attributeName(string): name of the attribute.
- Returns:
- A list of strings containing all the distinct values of an attribute of a layer.
-
VectorLayer.numeric(*args)¶ Returns the list of all numeric values of an attribute of a layer given the layer name and the attribute name.
- Args:
This method can be called in different ways, depending on what layer has to be inspected:
Getting the list of all numeric values of a layer giving its name and the attribute name:
layerName(string): name of the layer.attributeName(string): name of the attribute.
Getting the list of all numeric values of an attribute of the first layer of the dataset (see
VectorLayer.mainlayer()):attributeName(string): name of the attribute.
- Returns:
- A list of float containing all the numeric values of an attribute of a layer.
Create legends
-
VectorLayer.legendSet(*args)¶ Modifies the value of an attribute of a symbolizer to be applied to all items of a legend. This method is similar to
VectorLayer.get()but works for all the rules created by a call to one of the methods that create automatic legends (VectorLayer.legendSingle(),VectorLayer.legendCategories()andVectorLayer.legendGraduated()). Refer to theVectorLayer.get()description to obtain information about style names, rule names, symbolizer names and attribute names.- Args:
This method can be called in different ways, depending on what layer has to be modified:
Setting a value for an attribute giving the name of the layer and the name of the symbolizer:
layerName(string): name of the layer.symbolizerName(string): name of the symbolizer.attributeName(string): name of the attribute.value(string): value to assign to the attribute.
Setting a value for an attribute giving the name of the symbolizer of the first layer of the dataset (see
VectorLayer.mainlayer()):symbolizerName(string): name of the symbolizer.attributeName(string): name of the attribute.value(string): value to assign to the attribute.
- Example:
Create a VectorLayer from nuts1 dataset and create a single value legend (see
VectorLayer.legendSingle()method) and setting the line color to black and the line thickness to 0.25 for the polygon border:v = inter.VectorLayer("nuts1") v.legendSet('line','stroke','#000000') v.legendSet('line','stroke-width','0.25') v.legendSingle("#ff0000")
-
VectorLayer.legendSingle(*args)¶ Create a legend made up of a single symbol (all features of the layer are displayed with the same symbol).
- Args:
This method can be called in different ways, depending on what layer has to be modified:
Create a single symbol legend for a layer giving the name of the layer:
layerName(string): name of the layer.colorName(string): color to use for the symbol of the legend.
Create a single symbol legend for the first layer of the dataset (see
VectorLayer.mainlayer()):colorName(string): color to use for the symbol of the legend.
- Note:
- See
legend()global function on how to display the legend inside the notebook. - Example:
Create a VectorLayer from nuts1 dataset and create a single value legend and setting the line color to black and the line thickness to 0.25 for the polygon border (see
VectorLayer.legendSet()method):v = inter.VectorLayer("nuts1") v.legendSet('line','stroke','#000000') v.legendSet('line','stroke-width','0.25') v.legendSingle("#ff0000")
-
VectorLayer.legendCategories(*args)¶ Create a categorized legend (for all types attributes) having a different symbol for every distinct value of the attribute.
- Args:
This method can be called in different ways, depending on what layer has to be modified:
Create a categorized legend for a layer giving the name of the layer:
layerName(string): name of the layer.styleName(string): name of the style.attributeName(string): name of the attribute to use to create the legend by reading all the distinct values.
Create a categorized legend for the first layer of the dataset (see
VectorLayer.mainlayer()):attributeName(string): name of the attribute to use to create the legend by reading all the distinct values.
- Note:
- See
legend()global function on how to display the legend inside the notebook. - Example:
Create a Map instance:
map = Map()
map
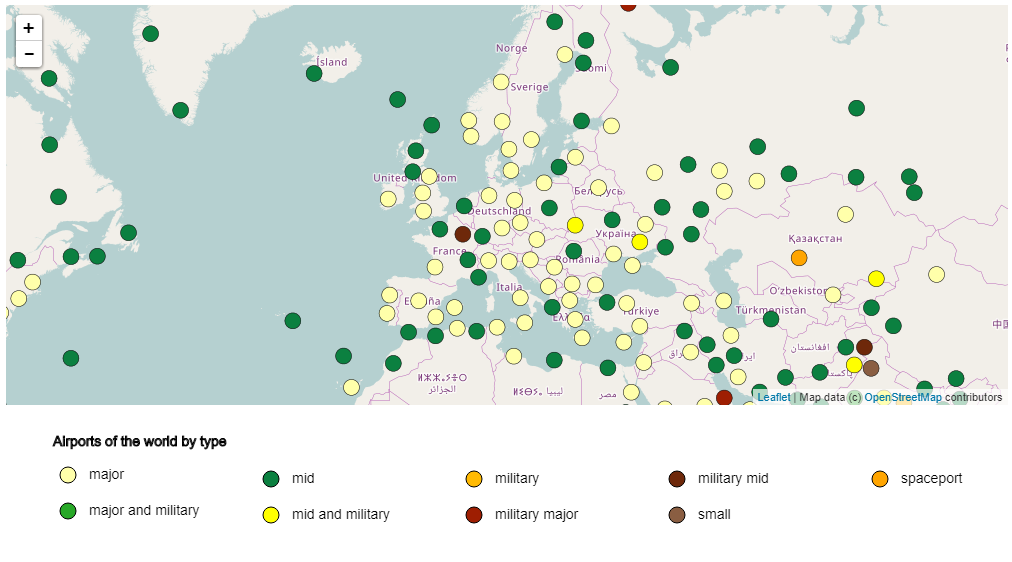
Create a VectorLayer from airports dataset. Create a categorized value legend on the type attribute, setting the dimension of points to 16 (see
VectorLayer.legendSet()method). Apply a custom color scheme:v = inter.VectorLayer("airports") v.legendSet('point','width','16') colors = ["#FFFFAA", "#27A827", "#0B8040", "Yellow", "#FFBA03", "#9E1E02", "#6E280A", "#8A5E42", "Orange"] v.colorCustom(colors) v.legendCategories("type") map.addLayer(v.toLayer())
To obtain an image of the legend use the
legend()global function:inter.legend(v,"Airports of the world by type",5)
-
VectorLayer.legendGraduated(*args)¶ Create a graduated values legend: it can be applied only to numerical attributes. Given a number of desired classes, this method creates a legend by subdividing the range of values of the attribute using different algorithms.
- Args:
This method can be called in different ways, depending on what layer has to be modified:
Create a graduated values legend for a layer giving the name of the layer:
layerName(string): name of the layer.styleName(string): name of the style.attributeName(string): name of the attribute to use to create the legend by reading all the distinct values.classificationType(string): type of classification method to create the intervals. It can be one of these values (optional, default = ‘natural’):equal: equal intervals (all intervals are equal size).quantile: quantile intervals (all intervals have the same number of features).natural: natural breaks (Jenks algorithm modified: Fisher’s Natural Breaks Classification).stddev: standard deviation breaks.pretty: pretty breaks.custom: use custom breaks passed in the list userbreaks
numClasses(integer): number of classes to create (optional, default = 5). Note that for some of the classification methods (mainly stddev and pretty) the actual number of classes can be different from the passed value.NumDigitAfterDot(integer): how many digit after the dot to be considered (optional, default = 2)minValue(double): custom minimum value (optional, default = the minimum value of the attribute)maxValue(double): custom maximum value (optional, default = the maximum value of the attribute)userbreaks(list of integer or float numbers): user breaks to be used whenclassificationType=custom
Create a graduated values legend for the first layer of the dataset (see
VectorLayer.mainlayer()):attributeName(string): name of the attribute to use to create the legend by reading all the distinct values.classificationType(string): type of classification method to create the intervals. It can be one of these values:equal: equal intervals (all intervals are equal size).quantile: quantile intervals (all intervals have the same number of features).natural: natural breaks (Jenks algorithm modified: Fisher’s Natural Breaks Classification), default.stddev: standard deviation breaks.pretty: pretty breaks.custom: use custom breaks passed in the list userbreaks
numClasses(integer): number of classes to create (optional, default = 5).NumDigitAfterDot(integer): how many digit after the dot to be considered (optional, default = 2)minValue(double): custom minimum value (optional, default = the minimum value of the attribute)maxValue(double): custom maximum value (optional, default = the maximum value of the attribute)userbreaks(list of integer or float numbers): user breaks to be used whenclassificationType=custom
- Note:
- See
legend()global function on how to display the legend inside the notebook. - Example:
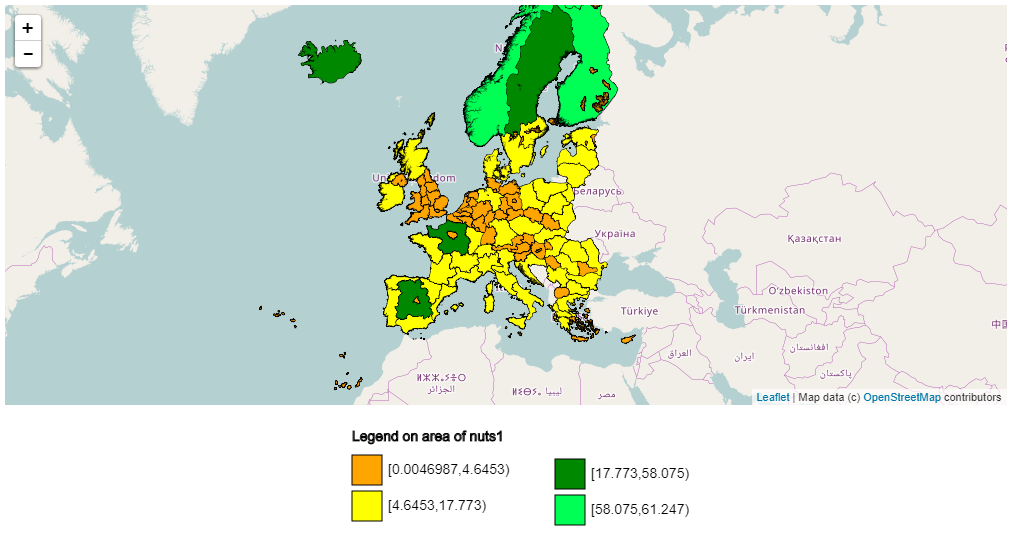
Create a VectorLayer from nuts1 dataset and create a graduated values legend of 4 classes using natural breaks classification on the area of the polygons (attribute ‘Shape_Area’) and setting the line color to black and the line thickness to 1.0 for the polygon border (see
VectorLayer.legendSet()method):v = inter.VectorLayer("nuts1").opacity(255) v.legendSet('line','stroke','#010000') v.legendSet('line','stroke-width','1.0') colors = ["Orange", "Yellow", "#008800", "#00ff55"] v.colorCustom(colors) v.legendGraduated("Shape_Area","natural",4)
Note that a custom color scheme is used (see
VectorLayer.colorCustom()).To obtain an image of the legend use the
legend()global function:inter.legend(v,"Legend on area of nuts1",2)
Selection of color schemes
-
VectorLayer.colorScheme(*args)¶ Select one of the available color schemes to apply to the VectorLayer in order to convert values to display colors. To have the list of all available color schemes users can call the
VectorLayer.printColorSchemes().- Args:
Name(string): Name of the color scheme to use for the display.PutInFirstPosition(integer): Index of color to put in first position. If a value greater than 0 is passed the color scheme is “shifted” by that amount (optional, default = 0).
-
VectorLayer.colorCustom(List)¶ Defines a custom color scheme from a list of user defined colors. Colors can be defined both using their names (i.e. ‘green’) or using the web format (i.e. ‘#00FF00’)
- Args:
List(python List of strings): List of strings containing names of codes of colors.
- Example:
Typical usage of the colorCustom function is given in the following pieces of code.
Create a Map instance:
map = Map()
map
Create a VectorLayer from airports dataset. Create a categorized value legend on the type attribute, setting the dimension of points to 16 (see
VectorLayer.legendSet()method). Apply a custom color scheme:v = inter.VectorLayer("airports") v.legendSet('point','width','16') colors = ["#FFFFAA", "#27A827", "#0B8040", "Yellow", "#FFBA03", "#9E1E02", "#6E280A", "#8A5E42", "Orange"] v.colorCustom(colors) v.legendCategories("type") map.addLayer(v.toLayer())
-
VectorLayer.printNamedColors(format=1)¶ Prints the list of named colors managed by the interactive visualization library. Colors can be selected using WEB format (#RRGGBB) or using names of colors in this list.
- Args:
format(integer): format to use for the R,G,B component of the named colors (optional, default = 1):- 0: components are written in CSV (i.e. 255,0,128).
- 1: components are written in WEB format (i.e. #FF05AA).
- 2: components are written in HEX format (i.e. FF05AA).
- Returns:
- The number of named colors printed.
-
VectorLayer.printColorSchemes()¶ Prints the list of of all available color schemes. Colors schemes can be used to customize the appearance of layers in the map by using the method
ImageProcess.colorScheme().- Returns:
- The number of color schemes printed.
Manage custom geometries to be displayed
-
VectorLayer.geomAdd(*args)¶ Adds a custom geometry to the VectorLayer instance. Geometries have to be passed with a string in the WKT format (Well Known Text format) and using the 4326 SRS (unprojected geographic coordinates based on WGS84).
- Args:
wktString(string): geometry to add written in WKT format on 4326 SRS (WGS84).
- Returns:
- True if successful, False otherwise.
- Note:
- To use the geomAdd method, create a VectorLayer instance by passing the dataset name “wkt”. See example below.
- Example:
Typical usage of the geomAdd function is given in the following pieces of code.
Create a Map instance:
map = Map()
map
Create a VectorLayer with the dataset “wkt”, add a geometry and customize its appearance before adding the layer to the map for display:
v = inter.VectorLayer("wkt").opacity(128)
v.geomAdd("POLYGON ((20 40, 0 45, 10 52, 30 52, 20 40))")
v.remove('default','all')
v.set('poly','fill','#ff0000')
v.set('line','stroke-width','5.0')
map.addLayer(v.toLayer())
-
VectorLayer.geomAddEx(*args)¶ Adds a custom geometry to the VectorLayer instance. Geometries have to be passed with a string in the WKT format (Well Known Text format) and using any SRS.
- Args:
wktString(string): geometry to add written in WKT format.EPSG(integer): EPSG of the SRS on which the geometry coordinates are based (optional, default = 4326).
- Returns:
- True if successful, False otherwise.
- Note:
- To use the geomAddEx method, create a VectorLayer instance by passing the dataset name “wkt”. See example below.
- Example:
Typical usage of the geomAdd function is given in the following pieces of code.
Create a Map instance:
map = Map()
map
Create a VectorLayer with the dataset “wkt”, add a geometry and customize its appearance before adding the layer to the map for display:
v = inter.VectorLayer("wkt").opacity(128)
v.geomAddEx("POLYGON ((20 40, 0 45, 10 52, 30 52, 20 40))",4326)
v.remove('default','all')
v.set('poly','fill','#ff0000')
v.set('line','stroke-width','5.0')
map.addLayer(v.toLayer())
-
VectorLayer.geomReset()¶ Removes all custom geometries added with previous calls to
VectorLayer.geomAdd(),VectorLayer.geomAddEx()orVectorLayer.fileAdd().
-
VectorLayer.fileAdd(*args)¶ Adds all geometries read from a local file (a file uploaded inside the Jupyter manager) to the VectorLayer instance. Possible formats are all that are managed by GDAL/OGR library as single files (shapefile, geojson, sqlite, etc.).
- Args:
filePath(string): Relative path of the file to load. It can be a .shp file, geojson, sqlite, etc. or any other format recognized by GDAL/OGR library.EPSG(integer): EPSG of the SRS on which the file coordinates are based (optional, default = 4326).
- Returns:
- True if successful, False otherwise.
- Note:
To use the fileAdd method, create a VectorLayer instance by passing the dataset name “wkt”. See example below.
This method is suitable for the import of small files (few MBs of storage space) since all geometries are read, converted to WKT and written directly on the mapnik XML file. If the file contains many geometries it is more efficient to use
loadLocalVector()which displays directly the OGR data source from the original format without any type of conversion.- Example:
Typical usage of the fileAdd function is given in the following pieces of code.
Create a Map instance:
map = Map()
map
Create a VectorLayer with the dataset “wkt”, add all geometries of a geojson file and customize its appearance before adding the layer to the map for display:
v = inter.VectorLayer('wkt')
v.remove('all')
v.set('line','stroke','#ff00ff')
v.set('line','stroke-width','3.0')
v.fileAdd('bialowieza.csv')
map.addLayer(v.toLayer())
-
VectorLayer.featuresAdd(*args)¶ Adds a list of features to the VectorLayer instance. Features are described by a JSON string that contains the WKT format (Well Known Text format) of the geometries. Tipically the string comes from a call to the
Map.getFeatures()An example of a valid JSON string for features is: “[{“wkt”: “POLYGON((-90.175781 56.298253, -72.597656 56.298253, -73.300781 48.727209, -92.285156 48.611122, -90.175781 56.298253))”}, {“type”: 6, “wkt”: “POLYGON((-14.765625 49.986552, 14.0625 51.433464, 17.402344 40.22083, -17.402344 38.453589, -14.765625 49.986552))”, “name”: “abcd”}]”- Args:
featuresString(string): JSON string containing an array of geometries, each of which should have the key “wkt” containing as value the WKT format (Well Known Text format) of the geometry.
- Returns:
- True if successful, False otherwise.
- Note:
- To use the featuresAdd method, create a VectorLayer instance by passing the dataset name “wkt”. See example below.
- Example:
Typical usage of the featuresAdd function is given in the following pieces of code.
Create a Map instance:
map = Map()
map
Activate a drawing control to add features:
map.drawPolygons()
Add one or more polygons by clicking on the buttons on the left side of the map and digitizing the vertices.
Create a VectorLayer with the dataset “wkt”, add all the edited features and customize their appearance before adding the layer to the map for display:
v = inter.VectorLayer("wkt").opacity(128)

v.featuresAdd(map.getFeatures())

v.remove('default','all')
v.set('poly','fill','#ff0000')
v.set('line','stroke-width','5.0')
map.addLayer(v.toLayer())
Join with user data
-
VectorLayer.joinAdd(*args)¶ Add a new join to a layer. Given an internal attribute of the VectorLayer, the join links to the geometric data a new attribute coming from an list of data values provided by the user. The match is done from a list of keys that must have the same number of elements of the data values list. These keys are matched againts the values of the internal attribute and, when a match exists, the corresponding data value is joined to the geographic features. The joined attribute behaves like a standard internal attribute: it can be identified, used to create a tematisation legend, etc.
- Args:
This method can be called in different ways, depending on what layer has to be modified:
Add a join to a layer giving the layer name:
layerName(string): name of the layer.attributeName(string): name of the internal attribute use for the matching.joinName(string): name of the join.ListOfKeys(python list of strings): List containing values of the keys to be matched against the values of the internal attribute.ListOfValues(python list of float or string or integer): List containing the data values to be assigned to geographic feature when a match is found between the list of key and the internal attributes of the features.
Add a join to the first layer of the dataset (see
VectorLayer.mainlayer()):attributeName(string): name of the internal attribute use for the matching.joinName(string): name of the join.ListOfKeys(python list of strings): List containing values of the keys to be matched against the values of the internal attribute.ListOfValues(python list of float or string or integer): List containing the data values to be assigned to geographic feature when a match is found between the list of key and the internal attributes of the features.
- Example:
A new data column containing the income per country is to be added to the Nuts1 vector dataset.
Create the VectorLayer using the nuts1 dataset:
v = inter.VectorLayer("nuts1")
Add a join called “Income” using ICC as the internal attribute and two list of respectively Keys and Values (note that the values list can be a python list or a numpy array):
import numpy as np
values = np.array([100.0, 80.0, 120])
v.joinAdd("ICC", "Income", ["IT", "GR", "FR"], values)
Create a custom color legend with three colors:
colors = ["red", "green", "blue"]
v.colorCustom(colors)
Create a Legend on the distinct values of the “Income” external joined attribute:
v.legendSet('line','stroke-width','0.5')
v.legendSet('line','stroke','#000000')
v.legendCategories("Income")
Add the layer to the map:
map.clear()
tlayer = map.addLayer(v.toLayer())
-
VectorLayer.joinExist(*args)¶ Returns True if a join having that name exists, False if not.
- Args:
This method can be called in different ways, depending on what layer has to be inspected:
Query the existance of a join for a layer giving its name and the join name:
layerName(string): name of the layer.joinName(string): name of the join.
Query the existance of a join for the first layer of the dataset (see
VectorLayer.mainlayer()):joinName(string): name of the join.
-
VectorLayer.joinRemove(*args)¶ Remove a join given its name.
- Args:
This method can be called in different ways, depending on what layer has to be modified:
Remove a join of a layer giving the layer name and the join name:
layerName(string): name of the layer.joinName(string): name of the join.
Remove a join of the first layer of the dataset (see
VectorLayer.mainlayer()):joinName(string): name of the join.
-
VectorLayer.joinReset(*args)¶ Remove all the joins from a layer.
- Args:
This method can be called in different ways, depending on what layer has to be modified:
Remove all joins of a layer giving the layer name:
layerName(string): name of the layer.
Remove all joins of the first layer of the dataset (see
VectorLayer.mainlayer()):No args
Overlay to raster data
-
VectorLayer.overlay(*args)¶ Overlays vector layer to an
ImageProcessinstance to calculate statistics (count, average, standard deviation, etc.) from pixels inside each of the geometries.- Args:
imgProc(ImageProcess): ImageProcess instance to use.FeatureIDFieldName(string): Name of the field containing a unique identifier of geometries.Query(string): Filter query to select a subset of the feature of the vector dataset. See the Examples session below (optional, default=”“).DistanceTolerance(float): Minimum distance from the centroid of a pixel and the border of the polygon (optional, default=4.0).PercentValidPixels(float): Requires that the non-cloudy pixels be at least this percentage of the total pixles inside the polygon, otherwise the image is not considered (optional, default=0.0).
- Returns:
- True if successful, False otherwise.
- Example:
Loading a local polygon shapefile as a vector layer:
v = inter.loadLocalVector("polygons.shp")
Overlay with a ImageProcess instance only a subset of the polygons:
p = inter.ImageCollection("C03").process()
v.overlay(p, "parcel_id", "type = 'A'")
Heatmaps from point data
-
VectorLayer.heatmap(*args)¶ Set the VectorLayer to display points in heatmap mode (Density mapping).
- Args:
Radius(float): Radius of influence of each of the points in meters.WeightFieldName(string): Name of the field containing weights for each of the points (optional, default=”“)WeightMin(float): Minimum value of the weights (optional, default=-100000).WeightMax(float): Maximum value of the weights (optional, default=100000).Query(string): Attribute query to use to select input points (optional, default=”“). Example query: “typeid = ‘SR’”
- Returns:
- A reference to the modified instance of
VectorLayer(so that this method can be chained with other methods using the . syntax). - Example:
Loading a point dataset as a vector layer (containing all ships detections on the Mediterranean sea):
v = inter.VectorLayer("ships")
Call heatmap method with a ratio of influence of 2 kilometers and by reading the weights (auto-limited to [0,0.05] range) from the attribute named “inv_nimages”:
v = v.heatmap(2000.0,"inv_nimages",0,0.05).opacity(190)
Select a color scheme and display the VectorLayer on the map:
v.colorScheme("RdYlGn_mixed_exp")
map.addLayer(v.toLayer())