Inter global functions
This group of functions contains utility routines that do non belong to a single class. These functions allow users to perform complex operations with the minimal number of lines of python code.
Collections search and creation
-
inter.collectionsSearch(*args)¶ Prints information on raster or vector data collections that match a search string
- Args:
SearchString(string): string or tag to search for (optional, default value = “”).showCodeSnippet(boolean): If True a sample code snipper is shown for each of the searched collections (optional, default value = False).
- Returns:
- Returns the number of matches found
- Example:
- inter.collectionsSearch(“Europa”,True)
-
inter.Collection(pathDescriptor)¶ Creates a collection (an ImageCollection in case of a raster dataset or a VectorLayer in case of a vector dataset) given the path descriptor of the collection. All the path descriptors are grouped on a tree structure under the global variable “collections”. Using the python auto-complete feature, it is possible to write “collections.” and then type the <TAB> key to get the list of all available completions and repeat the <TAB> key auto-completion until the desider collection is selected.
- Args:
pathDescriptor(collections.*): unique identifier of the collection
- Returns:
- In case the path descriptor identifies a raster data collection, an instance of
ImageCollectionclass is returned. In case the path descriptor identifies a vector data collection, an instance ofVectorLayerclass is returned.
Example:
Create a Sentinel-2 collection instance:
coll = Collections(collections.EarthObservation.Copernicus.Sentinel2)
Filter the collection on a geographic place and on a specific date:
coll = inter.ImageCollection("S2")
coll = coll.filterOnGeoName("Ispra")
coll = coll.filterOnDay(2017,10,14)
coll = coll.filterOn("cloudcover", "<=", 50)
coll = coll.filterOn("jrc_filepath", "<>", "")
Create an ImageProcess object from the filtere collection and add it as a layer to the map:
p = coll.process().bands(S2_HealthyVegetation)
map.addLayer(p)
Temporal sliders
-
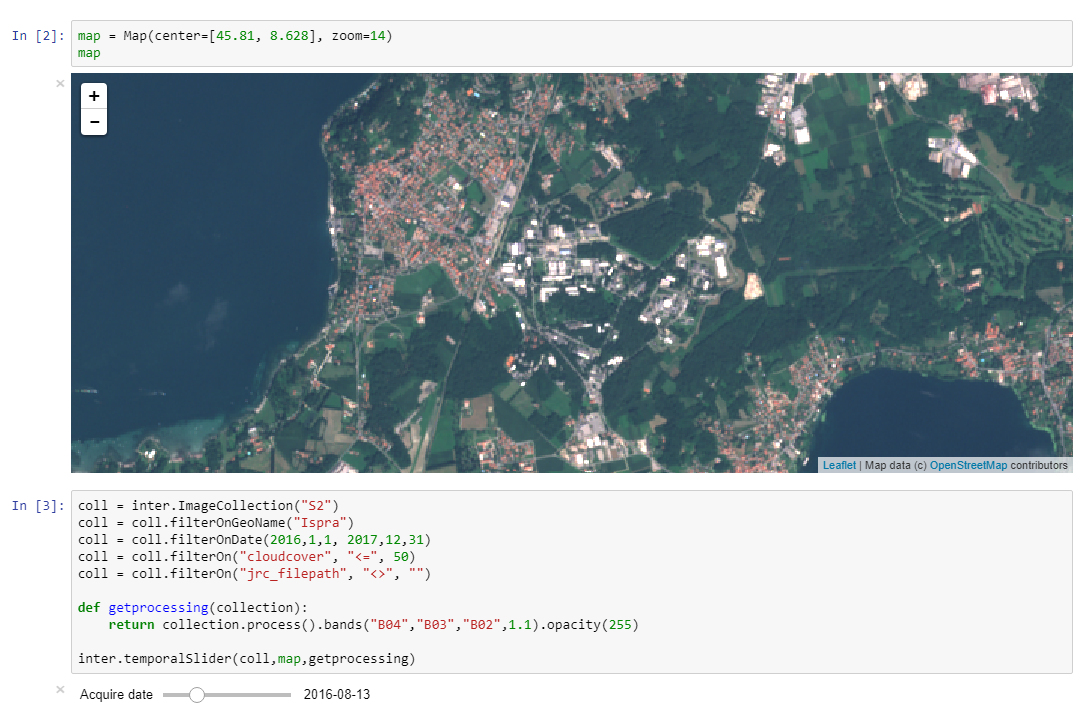
inter.temporalSlider(coll, map, function)¶ Creates a temporal slider to allow users to easily browse through all the acquisition days of an ImageCollection.
- Args:
coll(ImageCollection): An instance of anImageCollectionobjectmap(Map): An instance of aMapobjectfunction(function that takes anImageCollectionas input and returns anImageProcess): callback function to be called every time the slider is moved.
- Example:
Typical usage of the temporalSlider function is given in the following piece of code:
coll = inter.ImageCollection("S2")
coll = coll.filterOnGeoName("Ispra")
coll = coll.filterOnDate(2016,1,1, 2017,12,31)
coll = coll.filterOn("cloudcover", "<=", 5)
coll = coll.filterOn("jrc_filepath", "<>", "")

def getprocessing(collection):
    return collection.process().bands("B04","B03","B02",0.8).opacity(255)

inter.temporalSlider(coll,map,getprocessing)
Screenshot of a sample temporal slider over a Sentinel 2 image collection:
-
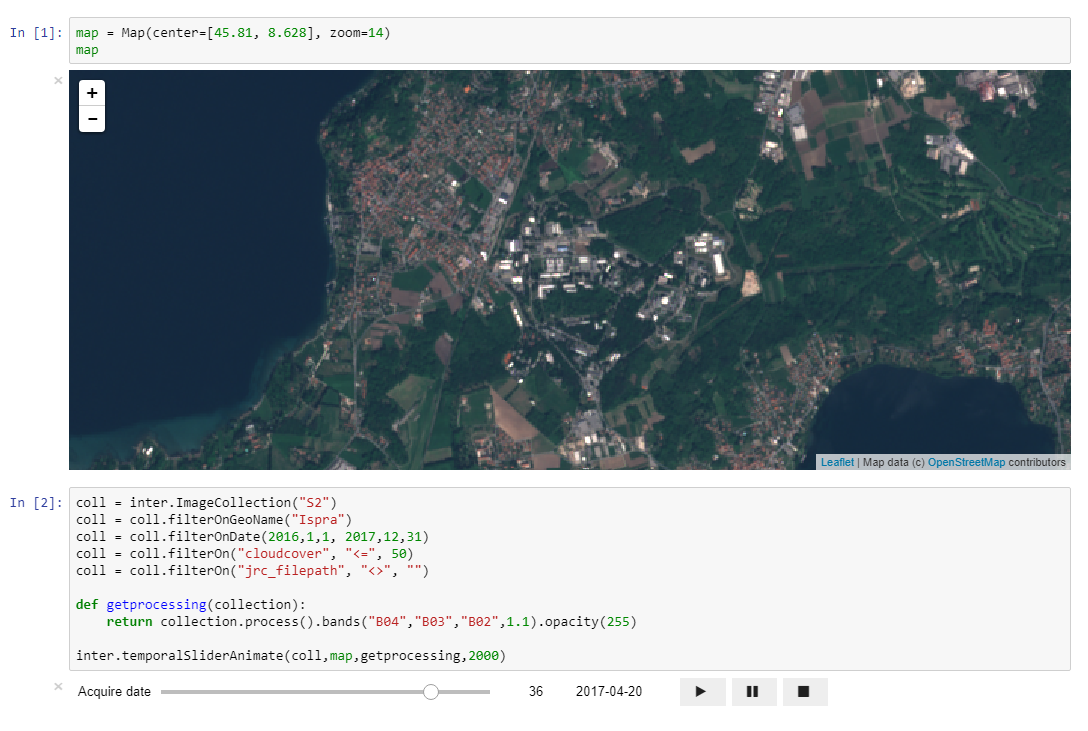
inter.temporalSliderAnimate(coll, map, function, waitinterval=1000)¶ Similarly to
temporalSlider()functon, temporalSliderAnimate creates a temporal slider with some added buttons to automatically play/pause/restart the animation between the acquisition days of the images inside the input ImageCollection.- Args:
coll(ImageCollection): An instance of anImageCollectionobjectmap(Map): An instance of aMapobject.function(function that takes anImageCollectionas input and returns anImageProcess): callback function to be called every time the slider is moved.waitInterval(integer): Wait interval between one day of the animation and the following one, expressed in milliseconds (optional, default = 1000).
- Example:
Typical usage of the temporalSliderAnimate function is given in the following piece of code:
coll = inter.ImageCollection("S2")
coll = coll.filterOnGeoName("Ispra")
coll = coll.filterOnDate(2016,1,1, 2017,12,31)
coll = coll.filterOn("cloudcover", "<=", 5)
coll = coll.filterOn("jrc_filepath", "<>", "")

def getprocessing(collection):
    return collection.process().bands("B04","B03","B02",0.8).opacity(255)

inter.temporalSliderAnimate(coll,map,getprocessing,2000)
Screenshot of a sample temporal slider with animation over a Sentinel 2 image collection:
-
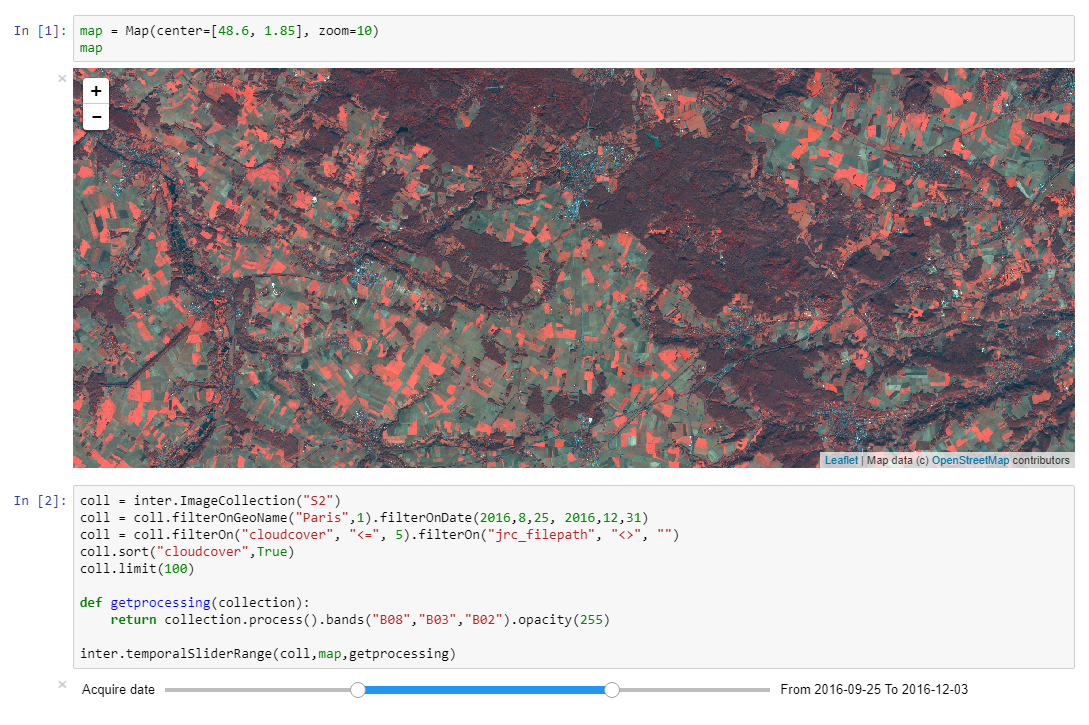
inter.temporalSliderRange(coll, map, function)¶ Creates a temporal slider to allow users to easily select a range of acquisition days of an ImageCollection and display the resulting images on a Map.
- Args:
coll(ImageCollection): An instance of anImageCollectionobjectmap(Map): An instance of aMapobjectfunction(function that takes anImageCollectionas input and returns anImageProcess): callback function to be called every time the slider is moved.
- Example:
Typical usage of the temporalSliderRange function is given in the following piece of code:
coll = inter.ImageCollection("S2")
coll = coll.filterOnGeoName("Ispra")
coll = coll.filterOnDate(2016,1,1, 2017,12,31)
coll = coll.filterOn("cloudcover", "<=", 5)
coll = coll.filterOn("jrc_filepath", "<>", "")

def getprocessing(collection):
    return collection.process().bands("B04","B03","B02",0.8).opacity(255)

inter.temporalSliderRange(coll,map,getprocessing)
Screenshot of a sample temporal slider with range selection over a Sentinel 2 image collection:
Export functions
-
inter.exportImage(map, imgProc, TiffFilePath)¶ Exports an instance of
ImageProcessto a georeferenced TIFF file. The path of the output file has to be a path relative to the special<home>/datafolder where the output file will be created. The input Map instance is used to define extents and zoom level of the exported file.- Args:
map(Map): An instance of aMapobject. The produced TIF file will cover the current extents and the current zoom level of the map.imgProc(ImageProcess): Instance of aImageProcessclass. This is the processing chain to be exported to file.TiffFilePath(string): File name of the .tif file to be produced on the special <home>/data folder.
- Returns:
- True if the export was successful, False otherwise.
- Example:
Typical usage of the exportImage function is given in the following pieces of code
Create the map instance and zoom to Ispra region:
map = Map(center=[45.81, 8.628], zoom=14)
map
Create a simple processing chain from Core003 dataset:
p = inter.ImageCollection("C03").process()
Export Core003 data on the current map view to TIFF:
inter.exportImage(map, p, "C03.tif")
-
inter.exportImageEx(minLongitude, minLatitude, maxLongitude, maxLatitude, zoomLevel, imgProc, TiffFilePath)¶ Given a rectangle (defined in (lat,lon) coordinates in EPSG 4326 and at a specific zoom level), the method exports the processing chain imgProc to a georeferenced TIFF file. The path of the output file has to be a path relative to the special
<home>/datafolder where the output file will be created. Please note that the export could cause the creation of big files (use methodsImageProcess.exportPixelsX()andImageProcess.exportPixelsY()to have width and height of the output image in pixels). In future version of the library the JEODPP infrastructure will set up a limit to the total number of pixel that can be exported and/or on the dimension of the file written to the local storage.- Args:
minLongitude(float): minimum longitude of the rectangle in degrees.minLatitude(float): minimum latitude of the rectangle in degrees.maxLongitude(float): maximum longitude of the rectangle in degrees.maxLatitude(float): maximum latitude of the rectangle in degrees.zoomLevel(integer): zoom level in the range [1,18].imgProc(ImageProcess): Instance of aImageProcessclass. This is the processing chain to be exported to file.TiffFilePath(string): path of the output file to produce in TIFF format (relative path from the <home>/data folder).
- Returns:
- True if the export is successful, False otherwise.
- Example:
The following lines of code provide an example of exporting in TIFF format the Core003 of a part of Italy:
p = inter.ImageCollection("C03").process()

lonmin = 10
lonmax = 14

latmin = 40
latmax = 45

zoom = 8
outputfile = "italy8.tif"

print "cellsize = " , p.exportCellsize(lonmin,latmin,lonmax,latmax,zoom)
print "pixel in X = " , p.exportPixelsX(lonmin,latmin,lonmax,latmax,zoom)
print "pixel in Y = " , p.exportPixelsY(lonmin,latmin,lonmax,latmax,zoom)
print "number of bytes = " , p.exportNumBytes(lonmin,latmin,lonmax,latmax,zoom)

inter.exportImageEx(lonmin,latmin,lonmax,latmax,zoom,p,outputfile)
-
inter.exportArray(map, imgProc, band=1)¶ Exports a band of an instance of
ImageProcessto a numpy array. The input Map instance is used to define extents and zoom level of the exported data.- Args:
map(Map): An instance of aMapobject. The produced TIF file will cover the current extents and the current zoom level of the map.imgProc(ImageProcess): Instance of aImageProcessclass. This is the processing chain to be exported to numpy array.band(integer): Index of the band to export (optional, default = 1).
- Returns:
- A two-dimensional numpy array.
- Example:
Typical usage of the exportArray function is given in the following pieces of code:
Create the map instance and zoom to Ispra region:
map = Map(center=[45.81, 8.628], zoom=14)
map
Create two simple processing chain from Core003 and DEM dataset:
p03  = inter.ImageCollection("C03").process()
pDEM = inter.ImageCollection("DEM").process()

print "Number of columns: " + str(inter.exportNumColumns(map))
print "Number of rows:    " + str(inter.exportNumRows(map))
Export Core003 data on the current map view to a numpy array:
a    = inter.exportArray(map, p03, 1)
elev = inter.exportArray(map, pDEM, 1)
Print the content of the two numpy arrays:
print a
print elev
-
inter.exportArrayEx(minLongitude, minLatitude, maxLongitude, maxLatitude, zoomLevel, imgProc, band=1)¶ Given a rectangle (defined in (lat,lon) coordinates in EPSG 4326 and at a specific zoom level), the method exports the processing chain imgProc to a numpy array. Please note that the export could cause the creation of big files (use methods
ImageProcess.exportPixelsX()andImageProcess.exportPixelsY()to have width and height of the output image in pixels). In future version of the library the JEODPP infrastructure will set up a limit to the total number of pixel that can be exported and/or on the dimension of the memory involved in the export.- Args:
minLongitude(float): minimum longitude of the rectangle in degrees.minLatitude(float): minimum latitude of the rectangle in degrees.maxLongitude(float): maximum longitude of the rectangle in degrees.maxLatitude(float): maximum latitude of the rectangle in degrees.zoomLevel(integer): zoom level in the range [1,18].imgProc(ImageProcess): Instance of aImageProcessclass. This is the processing chain to be exported to numpy array.band(integer): Index of the band to export (optional, default = 1).
- Returns:
- A two-dimensional numpy array.
- Example:
Typical usage of the exportArrayEx function is given in the following piece of code:
p = inter.ImageCollection(“C03”).process()
lonmin = 10 lonmax = 14
latmin = 40 latmax = 45
zoom = 8
a = inter.exportArrayEx(lonmin,latmin,lonmax,latmax,zoom, p, 1)
-
inter.exportTemporalGIF(coll, map, function, filename, delay=1000, blackLogo=True, LegendPNGFilePath='')¶ Exports to an animated GIF file a sequence of frames obtained from an ImageCollection by displaying the images acquired in any single acquisition day. It produces an animation that displays the evolution in time of the piece of land currently displayed on the map. The path of the output file has to be a path relative to the special
<home>/datafolder where the output file will be created.- Args:
coll(ImageCollection): An instance of anImageCollectionobjectmap(Map): An instance of aMapobjectfunction(function that takes anImageCollectionas input and returns anImageProcess): callback function to be called for every frame of the animation. The function can even return a python list containing more than one ImageProcess object: in that case the animation will display all the layers overlapped.filename(string): File name of the .gif file to be produced under the special <home>/data folder.delay(integer): Delay in milliseconds to wait during the GIF animation between frames (optional, default = 1000).blackLogo(boolean): Flag to control the overlay of a black or a white logo (optional, default = True).LegendPNGFilePath(string): File path of the .png file to be added as legend in the lower-left corner (optional).
- Returns:
- True if the export was successful, False otherwise.
- Example:
Typical usage of the exportTemporalGIF function is given in the following piece of code:
coll = inter.ImageCollection("S2")
coll = coll.filterOnGeoName("Ispra")
coll = coll.filterOnDate(2016,1,1, 2017,12,31)
coll = coll.filterOn("cloudcover", "<=", 5)
coll = coll.filterOn("jrc_filepath", "<>", "")

def getprocessing(collection):
    return collection.process().bands("B04","B03","B02",0.8).opacity(255)

inter.exportTemporalGIF(coll,map,getprocessing,"Ispra.gif",2000)
Sample animated GIF produced by inter.exportTemporalGIF function:
-
inter.exportTemporalVideo(coll, map, function, filename, fps=1, repeat=1, blackLogo=True, LegendPNGFilePath='')¶ Exports to a video file in MPEG4 or WEBM format a sequence of frames obtained from an ImageCollection by displaying the images acquired in any single acquisition day. It produces an animation that displays the evolution in time of the piece of land currently displayed on the map. The path of the output file has to be a path relative to the special
<home>/datafolder where the output file will be created.- Args:
coll(ImageCollection): An instance of anImageCollectionobjectmap(Map): An instance of aMapobjectfunction(function that takes anImageCollectionas input and returns anImageProcess): callback function to be called for every frame of the animation. The function can even return a python list containing more than one ImageProcess object: in that case the video will display all the layers overlapped.filename(string): File name of the .mp4 or .webm file to be produced under the special <home>/data folder.fps(integer): Frames per second of the produced video (optional, default = 1).repeat(integer): How many times a frame has to be repeated (optional, default = 1). Since fps is an integer, if each of the frames has to be displayed for more than 1 second, use repeat greater than 1.blackLogo(boolean): Flag to control the overlay of a black or a white logo (optional, default = True).LegendPNGFilePath(string): File path of the .png file to be added as legend in the lower-left corner (optional).
- Returns:
- True if the export was successful, False otherwise.
- Example:
Typical usage of the exportTemporalGIF function is given in the following piece of code:
coll = inter.ImageCollection("S2")
coll = coll.filterOnGeoName("Ispra")
coll = coll.filterOnDate(2016,1,1, 2017,12,31)
coll = coll.filterOn("cloudcover", "<=", 5)
coll = coll.filterOn("jrc_filepath", "<>", "")

def getprocessing(collection):
    return collection.process().bands("B04","B03","B02",0.8).opacity(255)

inter.exportTemporalVideo(coll,map,getprocessing,"Ispra.mp4")
-
inter.exportNumColumns(map)¶ Given an instance of a
Mapobject, the function calculates the number of columns that the export functions (exportImage(),exportArray()orexportTemporalGIF()) will produce as output.- Args:
map(Map): An instance of aMapobject. The produced output will cover the current extents and the current zoom level of the map.
- Returns:
- The number of columns of the export produced from the Map instance current view.
-
inter.exportNumRows(map)¶ Given an instance of a
Mapobject, the function calculates the number of rows that the export functions (exportImage(),exportArray()orexportTemporalGIF()) will produce as output.- Args:
map(Map): An instance of aMapobject. The produced output will cover the current extents and the current zoom level of the map.
- Returns:
- The number of rows of the export produced from the Map instance current view.
-
inter.stats(map, imgProc, ScalingFactor)¶ Calculate and returns the statistics of an instance of
ImageProcessclass. The input Map instance is used to define extents and zoom level for the calculation.- Args:
map(Map): An instance of aMapobject. The statistics are calculated on the current extents and the current zoom level of the map.imgProc(ImageProcess): Instance of aImageProcessclass. This is the processing chain for which the statistics are calculated.ScalingFactor(float): How many “standard deviation” around the mean value of the band should be considered for scaling band original values to BYTE for visualization. The values in the range [mean - ScalingFactor*StdDev, mean + ScalingFactor*StdDev] are linearly mapped to the range [0,255] (optional, default = 2.0)
- Returns:
- If the input imgProc is a single-band processing chain, two values are returned: the min and max value to be used to scale the pixel values to convert to BYTE for visualization.
If the input imgProc is an RGB processing chain, two values are returned per each of the three bands (R, G, and B), six values in total: each couple of values contains the min and max value to be used to scale the pixel values to convert to BYTE for visualization.
These values can be directly copy and pasted in the call to
ImageProcess.scale()method. - Example:
Typical usage of the stats function is given in the following pieces of code:
Create the map instance and zoom to Ispra region:
map = Map(center=[45.81, 8.628], zoom=14)
map
Create a simple processing chain from Core003 dataset:
p = inter.ImageCollection("C03").process()
Get the statistics of the ImageProcess instance on the viewable area of the map:
print inter.stats(map, p)
In order not to have a print with many decimal characters:
print [int(i) for i in inter.stats(map,p)]
Load local files
-
inter.loadLocalRaster(FileName, epsg=3857)¶ Loads a local raster file (stored inside the special
<home>/datafolder ) to create an instance of aImageProcessthat can be added as a layer to a Map. Files to load can be produced by the export functions or be uploaded by the user to the local folder of the notebook.- Args:
FileName(string): File name of the raster file to be loaded. The path of the input file has to be a path relative to the special<home>/datafolder.epsg(integer): EPSG code of the input file SRS (optional, default = 3857)
- Returns:
- An instance of
ImageProcess - Example:
Typical usage of the loadLocalRaster function is given in the following pieces of code.
Create the map instance:
map = Map()
map
Load the local .tif file and add to the Map to visualize it:
p = inter.loadLocalRaster("C03.tif")
map.addLayer(p.toLayer())
-
inter.loadLocalVector(FileName, LayerName='', epsg=0)¶ Loads a local vector file (stored inside the special
<home>/datafolder) to create an instance of aImageProcessthat can be added as a layer to a Map. Files to load can be shapefiles, geoJSON or SQLite files uploaded by the user to the local folder of the notebook.- Args:
FileName(string): File name of the vector file to be loaded. The path of the input file has to be a path relative to the special<home>/datafolder.LayerName(string): Name of the layer to load (optional, default = “”).epsg(integer): EPSG code of the input file SRS (optional, default = 0 which means that the EPSG has to be read from the .prj file associated to the input file)
- Returns:
- An instance of
ImageProcess - Example:
Typical usage of the loadLocalVector function is given in the following pieces of code.
Create the map instance:
map = Map()
map
Given that a file named roads.shp (with all the .shx, .dbf and .prj files having the same name) exist on the local folder, load the shapefile and customize its graphic properties (color and thickness). (For a detailed description of the graphic customization of a vector file see
VectorLayer):v = inter.loadLocalVector("roads.shp") v.remove('all') v.set('line','stroke','#009900') v.set('line','stroke-width','3.0') map.addLayer(v.toLayer())
-
inter.loadUserRaster(UserName, FileName, epsg=3857)¶ Loads a raster file (stored inside the special
<home>/datafolder of the user UserName) to create an instance of aImageProcessthat can be added as a layer to a Map. In order for the file to be correctly displayed, it has to have read permission for “other”.- Args:
UserName(string): Name of the user.FileName(string): File name of the raster file to be loaded. The path of the input file has to be a path relative to the special<home>/datafolder of the user UserName.epsg(integer): EPSG code of the input file SRS (optional, default = 3857)
- Returns:
- An instance of
ImageProcess - Example:
Typical usage of the loadUserRaster function is given in the following pieces of code.
Create the map instance:
map = Map()
map
Load the local .tif file and add to the Map to visualize it:
p = inter.loadUserRaster("davide","C03.tif")
map.addLayer(p.toLayer())
Graphical User Interface functions
-
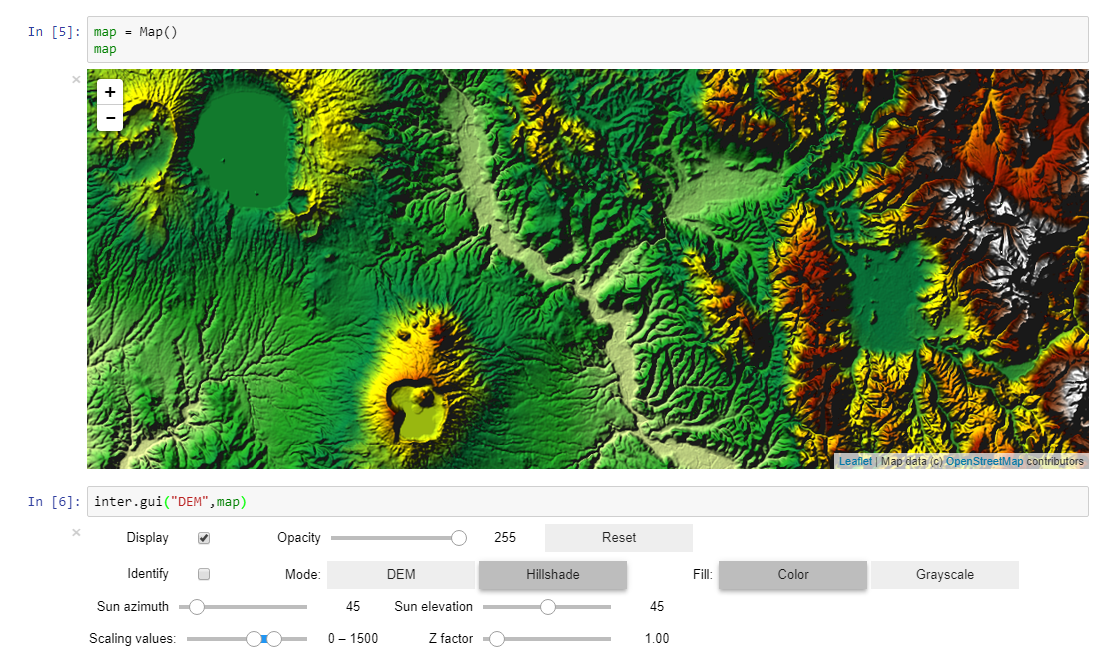
inter.gui(type, map)¶ Given a map, the function creates a graphical user interface to display complex dataset without the need to write lines of python code. To now, the functon can be used only to visualize DEM (Digital Elevation Model) data and to interactively select all the parameters for display customization.
- Args:
type(string): A string defining what type of data has to be displayed. To now, the following values are implemented:- ‘DEM’ or ‘EUDEM’ Display EUDEM dataset
- ‘SRTM’ Display SRTM dataset
- ‘GEBCO’ Display GEBCO dataset
map(Map): An instance of aMapobject where the display of the DEM data has to be added.
- Example:
Typical usage of the loadLocalVector function is given in the following pieces of code.
Create the map instance:
map = Map()
map
Display the EUDEM dataset with interactive widgets to easily customize the visualization:
inter.gui("DEM",map)
The widgets generated by the call to gui function allow users to select the display mode (DEM or Hillshading), the color mode (color or grayscale), the sun azimuth and elevation, opacity, zfactor and scaling values.
Screenshot of EUDEM gui:
-
inter.identify(map, process, label)¶ The functions allows users to graphically request the real values of a processing chain element added to a Map. It add a special marker to the Map that can be moveed by the user using the mouse: every time the marker is moved, a query of the underlining value is performed and the results are display in a Label widget
- Args:
map(Map): An instance of aMapobject where the identify function has to be perfomed.process(ImageProcess): Instance of aImageProcessclass. This is the processing chain to be exported to numpy array.label(Label): Instance of a ipywidgets.Label class. This is the graphical element where the identify text is written after any marker movement by the user.
- Example:
Typical usage of the identify function is given in the following pieces of code.
Create the map instance and a Label object under it that spans all the width of the browser page:
from ipywidgets import widgets
map = Map()
label = widgets.Label(layout=widgets.Layout(width='100%', max_width='1000px'))
widgets.VBox([map, label])
Create a collection that selects Sentinel 2 images over Amatrice for the dates just after the earthquake:
coll = inter.ImageCollection("S2")
coll = coll.filterOnGeoName("Amatrice",0).filterOnDate(2016,8,25, 2016,12,31)
coll = coll.filterOn("cloudcover", "<=", 5).filterOn("jrc_filepath", "<>", "")
coll.limit(10)
Then a processing element creating a false color RGB composition is derived from the collection and displayed on the map, activating the identify marker to query the pixel values and output them to the label:
p = coll.process().bands("B08","B03","B02")
map.clear()
map.addLayer(p.toLayer())
map.zoomToImageExtent(p)
mark = inter.identify(map,p,label)
-
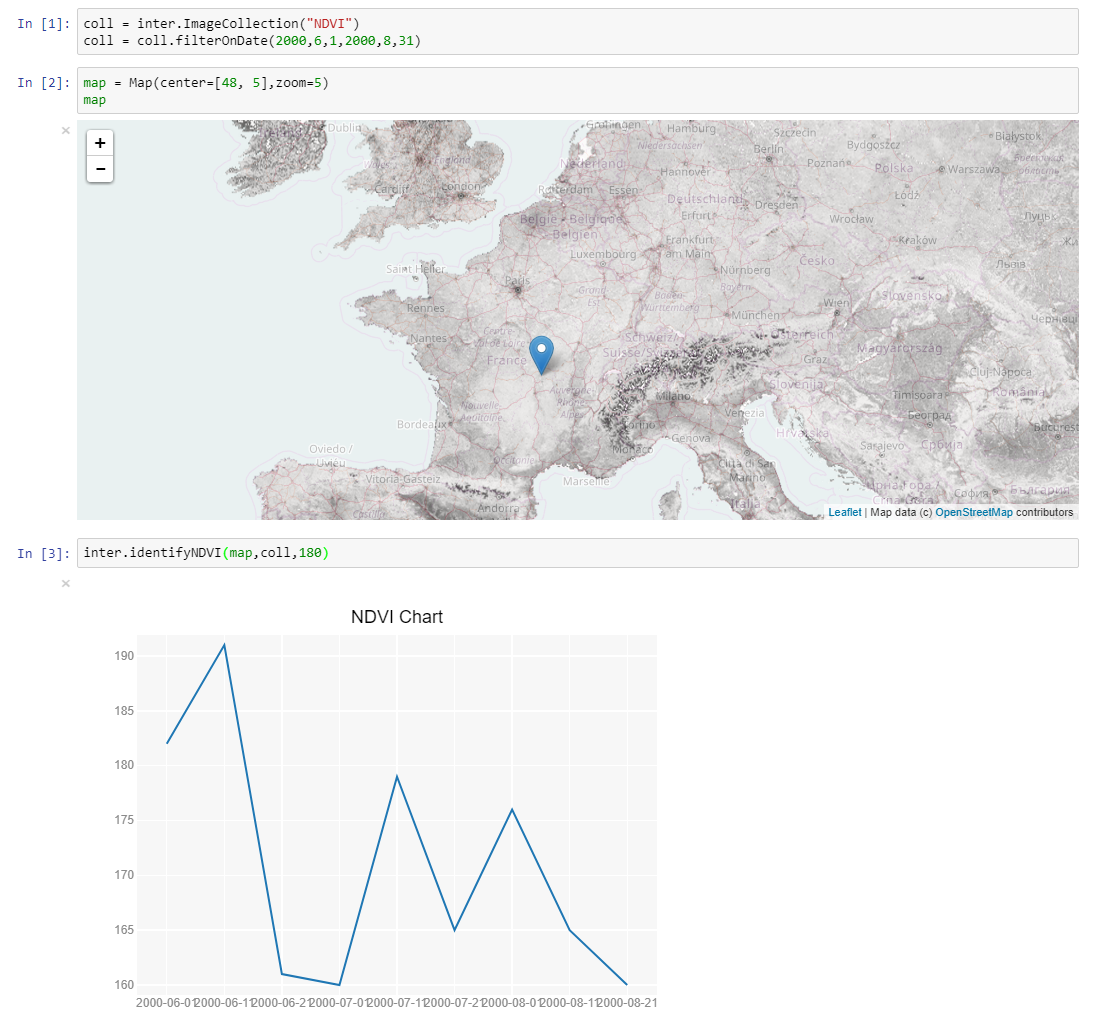
inter.identifyNDVI(map, coll, opacity=180)¶ The functions is a version of the identify tailored for the NDVI dataset. It allows users to query the multi-year NDVI values and display them in a plot
- Args:
map(Map): An instance of aMapobject where the identify function has to be perfomed.coll(ImageCollection): Instance of aImageCollectionclass. This is the input NDVI collection that should be filtered on a date range.opacity(integer): Value of opacity to display the NDVI values (optional, default = 180)
- Example:
Typical usage of the identifyNDVI function is given in the following pieces of code.
Create the map:
map = Map(center=[48, 5],zoom=5)
map
Create the NDVI collection: from the original data (1998 to 2013) two months of summer 2000 are selected:
coll = inter.ImageCollection("NDVI")
coll = coll.filterOnDate(2000,6,1,2000,8,31)
Call the identifyNDVI function to plot the time series:
inter.identifyNDVI(map,coll,180)
Screenshot of NDVI identify:
-
inter.identifyPopup(map, p)¶ Activates the identify on an ImageProcess or on a VectorLayer by directly displaying a popup on the map at the user click
- Args:
map(Map): An instance of aMapobject where the identify function has to be perfomed.p(ImageProcess): Instance of aImageCollectionor aVectorLayerclass.
- Example:
Typical usage of the identifyPopup function is given in the following pieces of code.
Create the map:
map = Map()
map
Create the nuts1 layer and add it to the map:
v = inter.VectorLayer("nuts1")
layer = map.addLayer(v.toLayer())
Call the identifyPopup function query the vector layer attributes by clicking on the feature displayed on the map:
inter.identifyPopup(map,v)
-
inter.s2explorer(map, rows=20)¶ Application made up using ipython widgets that can be used to browse, filter, sort and visualize Sentinel-2 images. It displays a “Search…” button that, when clicked, queries the data catalog for all the available Sentinel-2 products that intersect the current boundary of the map. The results are displayed on a grid that shows information on acquisition date, relative orbit, product processing level, satellite platform (A or B), product storage size, cloud cover percentage, UTM zone and MGRS tile. All these columns can be used to filter the products and to sort in ascending or descending mode. Clicking on a grid row activates the display of the corresponding product on the map. Multiple selection can be activated using the Ctrl and/or Shift keyboard key. The checkboxes allow for the selection of what is to be displayed on the map:<br> Clouds checkbox controls the display of the cloud mask from GML file available for all Sentinel-2 products.<br> Class checkbox controls the display of the scene classification available only for L2A images (see
s2scl()function to display the scene classification legend) .<br> Image checkbox controls the display of the image pixels in RGB.<br> Footprint checkbox controls the display of the image footprint.<br>Args:
map(Map): An instance of aMapobject.rows(integer): Number of rows to display on the grid (optional, default = 1).
Example:
Create a Map:
map = Map()
map
Activate the s2explorer on the map:
inter.s2explorer(map)
Legend display and management
-
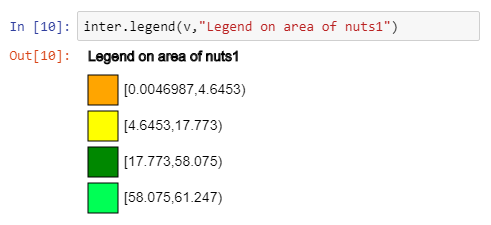
inter.legend(vectorLayer, Title='Legend', NumberOfColumns=1)¶ Displays the legend of a VectorLayer (see
VectorLayer.legendSingle(),VectorLayer.legendCategories()orVectorLayer.legendGraduated()) inside the notebook.- Args:
vectorLayer(instance of VectorLayer): An instance of aVectorLayerobject.Title(string): Title of the legend (optionale, default = “Legend”).NumberOfColumns(integer): Number of columns that the legend has to occupy (optional, default = 1)
- Example:
Typical usage of the legend function is given in the following pieces of code.
Create the map:
map = Map()
map
Create the nuts VectorLayer and a graduated value legend based on the area of polygon:
v = inter.VectorLayer("nuts1")
v.legendSet('line','stroke','#000000')
v.legendSet('line','stroke-width','1.0')
colors = ["Orange", "Yellow", "#008800", "#00ff55"]
v.colorCustom(colors)
v.legendGraduated("Shape_Area","natural",4,5)
map.addLayer(v.toLayer())
Call the legend function to display the legend giving a title:
inter.legend(v,"Legend on area of nuts1")
Result of the call to legend function:
-
inter.svg(svgstring)¶ Displays the svg string passed as argument.
- Args:
svgstring(string): String containing valid SVG code.
-
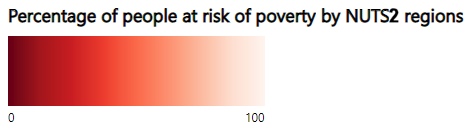
inter.colorSchemaLegend(Name, Title='', Markers=False, Height=50, MinValue=0.0, MaxValue=100.0)¶ Calculates and returns the SVG string to display the legend of a ColorSchema. To display the legend, the result of the call to colorSchemaLegend can be passed to
svg()method.- Args:
Name(string): Name of the color schema to display.Title(string): Title to be displayed on top of the legend (optional, default value = “”).Markers(boolean): Flag to display the markers for minimum and maximum values below the legend (optional, default value = False).Height(integer): height in pixels of the legend (optional, default = 50)MinValue(float): Marker value for the minimum (optional, default = 0.0)MaxValue(float): Marker value for the maximum (optional, default = 100.0)
Examples:
Display of the standard DEM legend:
inter.svg(inter.colorSchemaLegend("DEM"))
Display of a legend on percentage values containing also the title and the markers:
svg(colorSchemaLegend("Reds_soft",
                      "Percentage of people at risk of poverty by NUTS2 regions",
                      True, 70, 0.0, 100.0))
Result of the last sample call to colorSchemaLegend function:
-
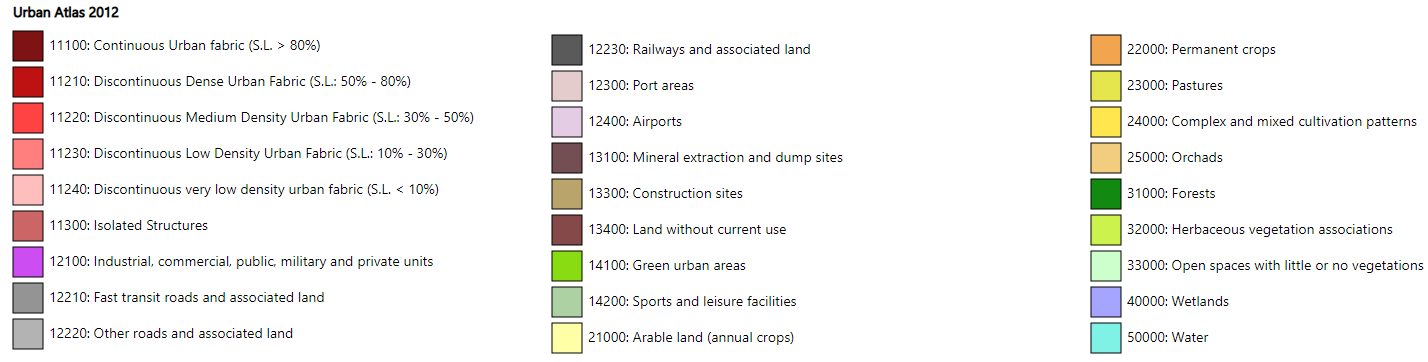
inter.UAlegend(Version='2006', columns=1)¶ Displays the legend for Urban Atlas dataset, showing colors and descriptions of all the classes for the 2006 or 2012 version.
- Args:
Version(string): version of the dataset to use, “2006” or “2012” (optional, default value = “2006”).columns(integer): Number of columns that the legend has to occupy (optional, default = 1)
-
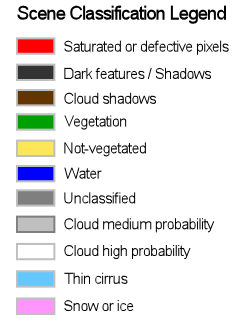
inter.s2scl()¶ Displays the legend of the Scene Classification for L2A products
List raster and vector datasets
-
inter.listImageCollections()¶ Prints the list of all available ImageCollection datasets with a brief description. The functions can be useful to discover all the possible names that can be passed to create an instance of ImageCollection, see
ImageCollection.
-
inter.listVectorLayers()¶ Prints the list of all available vector datasets with a brief description. The functions can be useful to discover all the possible names that can be passed to create an instance of VectorLayer, see
VectorLayer.
Search functions
-
inter.search(*args)¶ Search for a location by name (using online GeoNames service). The functions is a version of the identify tailored for the NDVI dataset. It allows users to query the multi-year NDVI values and display them in a plot
- Args:
LocationName(string): name of the location to search for. It can be a city, a region, etc..Country(string): two digit country code of the country to help in case the search in case of locations present in more than one conutry (optional, default value = “”).
- Returns:
- Returns a list containing [CenterLat CenterLon ZoomLevel]
- Example:
Typical usage of the search function is to pass the returned value to the
Map.zoomToExtent()method, as showed in the following pieces of code:map = Map() map.zoomToExtent(inter.search("Ispra")) map
Save edited features to shapefile
-
inter.saveShapefile(*args)¶ Save a list of features described in a JSON string to a file in shapefile format. Tipically the features are digitized by a call to
Map.drawPolygons(),Map.drawPolylines()orMap.drawPoints()and passed to the saveShapefile global function by callingMap.getFeatures(). An example of the JSON string that can be passed to this function is: “[{“wkt”: “POLYGON((-90.175781 56.298253, -72.597656 56.298253, -73.300781 48.727209, -92.285156 48.611122, -90.175781 56.298253))”}, {“type”: 6, “wkt”: “POLYGON((-14.765625 49.986552, 14.0625 51.433464, 17.402344 40.22083, -17.402344 38.453589, -14.765625 49.986552))”, “name”: “abcd”}]”- Args:
featuresString(string): a JSON string containing the an array of objects each one having a key named �wkt� containing the Well Known Text format of the geometry and possibly other attribute names and values.filepath(string): path of the file where the feature have to be saved.
- Example:
Typical usage of the function is given in the following pieces of code.
Create a map:
map = Map()
map
Activate the creation of polygonal features:
map.drawPolygons()
Set some attributes for the polygons that are going to be created:
map.setAttributeValues(type=1, name='abcd')
Then the digitizing can be activated by clicking on the button on the left side of the map.
At the end of the digitization process, the features can be saved in shapefile format (with their attributes):
inter.saveShapefile(map.getFeatures(),"polygons.shp")
Execute helper functions
-
inter.testExecute(*args, **kvargs)¶ Helper function to test the syntactic correctness of python functions definition and call made by the processing step
ImageProcess.execute(). Before sendig a python function to be executed server-side in the context of a processing chain evaluation, it is advisable to call testExecute global function passing the same parameters used in the execute call.Args:
func(python function object): Python function to test execute*args, **kvargs: Input parameters to be passed in the call to the python function. These parameters can be passed both by oder and by key-value.OptionalModificators: Parameters that influence the way the python function is executed. They can be any of this list of values:
Optional modificator Effect on the processing chain execution EXECUTE_Tile Executes the python function on 256x256 tiles (DEFAULT) EXECUTE_Window Executes the python function on the visible window EXECUTE_SingleOutput A single band output is produced from all the input bands (DEFAULT) EXECUTE_MultiOutput The python function is called on a band-by-band mode EXECUTE_Enlarge0 Process exactly the input area without any enlargement EXECUTE_Enlarge1 Enlarge the processing area by 1 pixel for each side EXECUTE_Enlarge2 Enlarge the processing area by 2 pixels for each side EXECUTE_Enlarge3 Enlarge the processing area by 3 pixels for each side EXECUTE_Enlarge4 Enlarge the processing area by 2 pixels for each side - Returns:
- True in case the definition and the call of the python function are sintactically correct. False in case some errors are present oruin the definition or in the call to the python function.
Example:
Definition of a python function that works on a single band and uses numpy sintax to change any not-NODATA pixel of the input img array by summing a scalar n:
def add(n):
    global img
    img[img>0] += n
Definition of a python function that works on a single band and uses scipy.ndimage library to perform a sobel filtering:
def sobel():
    global img
    img = ndimage.sobel(img)
Test execution of the two python function:
inter.testExecute(add,EXECUTE_Tile,100)    # Returns True

inter.testExecute(sobel,5)                 # Returns False and an error because the sobel python function doesn't have any parameter.