Map class
-
class
inter.Map¶ Map class is the class to use to add a drawing surface to the ipython notebook. A Map can then be used to add
ImageProcessobjects as layers on the visualization. Zoom and Pan functions are available using the keyboard and the mouse. To emit the map it is sufficient to create a variable holding an instance of the Map class and then put the variable name as the last row in the ipython cell.- Examples:
To create a Map use this code:
map = Map()
map
To add a
ImageProcessp object to the Map as a layer use code like:map.addLayer(p.toLayer())
- Notes:
In the call to create an instance of a Map object it is possible to specify many optional parameters that can customize the Map appearance and its initial status. Here is a list of available parameters with samples of their usage:
center([lat,lon]): Centers the Map on a latitude,longitude position.Example:
map = Map(center=[56,10])
map
zoom(integer): Sets the initial zoom level of the Map (values in the range [1,18]).Example:
map = Map(zoom=8)
map
side(string): Sets the title of the map element and displays it on the right side of the pageExample:
map = Map(side='Main Map')
layout: Sets the layout of the map using ipywidgets Layout class to customize the map dimensions.Example: to change the height in pixel of the Map area to 800 pixels (default is 400 pixels):
from ipywidgets import Layout
map = Map(layout=Layout(height='800px'))
map
basemap(integer or basemaps.*): Sets the basemap to show as the basic layer of the Map (default = 1, Open Street Map). To have a list of all the available basemaps the methodMap.printAvailableBasemaps()can be called. if the format basemap=basemaps.* is used, the python autocompletion can be used to easily select all availabre basemapsExample:
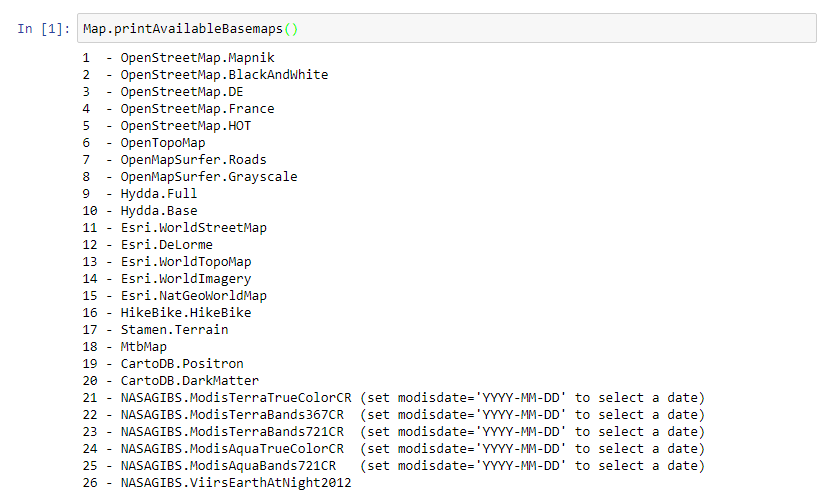
To list all available basemaps, call the static method Map.printAvailableBasemaps():
Map.printAvailableBasemaps()
To display a different basemap:
map = Map(basemap=7)
map
Or:
map = Map(basemap=basemaps.Esri.WorldImagery)
Use the following code to get the list of all basemaps families or elements of a family:
basemaps.keys()
basemaps.Strava.keys()
modisdate(date as string in ‘YYYY-MM-DD’ format): For all MODIS basemaps (basemap from 21 to 25) it is possible to select a specific date (default is yesterday).Example:
map = Map(basemap=24, modisdate='2017-06-16')
map
To display the notebook at full page (or to change the width of the Map object), these lines of code can be used:
from IPython.core.display import display, HTML
display(HTML("<style>.container { width:100% !important; }</style>"))
It is possible to query the current status of some internal properties of the Map objects like in the following piece of code:
print map.center
print map.zoom
print map.bounds
Layers’ management
-
Map.addLayer(procid, name=None, base=False, replace=True, nocache=False, tilecache=False, forceWindowBased=False)¶ Adds a new layer to a Map.
- Args:
procid(string): Process ID of the processing chain to add, usually obtained from a call toImageProcess.toLayer()method.name(string): Assign name to layer property (optional, default = None). If the name of a layer is set it can be used in methods likeMap.removeLayerByName().base(boolean): if True the layer is considered a base layer in the LayersControl (optional, default = False)replace(boolean): if True and “name” argument != None then replaces layer with same name, even if procid changes (optional, default = True)nocache(boolean): if True then layer will not be cached in browser (optional, default = False)tilecache(boolean): if True then tile image will be saved in file cache (optional, default = False)forceWindowBased(boolean): if True the layer is requested to the server in WindowMode (a single display for the whole viewport at each pan or zoom) (optional, default = False)
- Returns:
- An instance of a layer object.
- Example:
Typical usage of the addLayer method is given in the following piece of code
Create the map instance:
map = Map()
map
Create a simple processing chain from Core003 dataset:
coll = inter.ImageCollection("C03")
p = coll.process()
Add the processing chain as a layer to the Map:
map.addLayer(p.toLayer())
-
Map.addBasemap(basemap, name=None, base=False, replace=True)¶ Add a basemap layer to the map
- Args:
basemap: id of the basemap to add (i.e. basemaps.Strava.All)name(string): Assign name to layer property (optional, default = None). If the name of a layer is set it can be used in methods likeMap.removeLayerByName().base(boolean): if True the layer is considered a base layer in the LayersControl (optional, default = False)replace(boolean): if True and “name” argument != None then replaces layer with same name, even if procid changes (optional, default = True)
- Returns:
- An instance of a layer object.
- Example:
Typical usage of the addBasemap method is given in the following piece of code
Create the map instance:
map = Map()
map
Add a Strava basemap as a new layer to the map:
map.addBasemap(basemaps.Strava.All)
To get the list of all available basemaps, execute this line of code:
basemaps.keys()
or:
basemaps.Strava.keys()
-
Map.addVideo(url, bounds, name=None, base=False)¶ Add a video overlay layer to the map
- Args:
url: url of the video, usually in .webm format. Example: https://www.mapbox.com/bites/00188/patricia_nasa.webmbounds: bounds in lat/long coordinates where the video has to be displayed. Example: bounds = [(12,-130),(32,-100)]name(string): Assign name to layer property (optional, default = None). If the name of a layer is set it can be used in methods likeMap.removeLayerByName().base(boolean): if True the layer is considered a base layer in the LayersControl (optional, default = False)
- Returns:
- An instance of a layer object.
Example:
Create the map instance:
map = Map(center=[20,-100],zoom=4)
map
Add a video to the map and display a slider to select its opacity:
video = map.addVideo('https://www.mapbox.com/bites/00188/patricia_nasa.webm', [(12,-130),(32,-100)], 'Hurricane video')
video.interact(opacity=(0.0,1.0,0.01))
-
Map.addWMS(url='', layers='', min_zoom=0, max_zoom=18, opacity=1.0, styles='', crs='', format='image/jpeg', name=None, base=False)¶ Add a WMS layer to the map
- Args:
url(string): url of WMS servicelayers(string): name of the layer(s) to displayname(string): Assign name to layer property (optional, default = None). If the name of a layer is set it can be used in methods likeMap.removeLayerByName().base(boolean): if True the layer is considered a base layer in the LayersControl (optional, default = False)
- Returns:
- An instance of a layer object.
Example:
Create the map instance to be displayed on the right side:
map = Map(side='WMS demo')
Add a WMS service:
layer = map.addWMS(url="https://demo.boundlessgeo.com/geoserver/ows?",
            layers="nasa:bluemarble",
            name='Nasa BlueMarble basemap',
            base=True)
-
Map.replaceLayer(layer, procid, name=None, base=False, nocache=False, tilecache=False, forceWindowBased=False)¶ Replaces a layer on the map with a new procid.
- Args:
layer(obj): map layer to replaceprocid(string): Process ID of the processing chain, usually obtained from a call toImageProcess.toLayer()method.name(string): Assign name to layer property (optional, default = None). If the name of a layer is set it can be used in methods likeMap.removeLayerByName().base(boolean): if True the layer is considered a base layer in the LayersControl (optional, default = False)nocache(boolean): if True then layer will not be cached in browser (optional, default = False)tilecache(boolean) : if True then tile image will be saved in file cache (optional, default = False)forceWindowBased(boolean): if True the layer is requested to the server in WindowMode (a single display for the whole viewport at each pan or zoom) (optional, default = False)
- Returns:
- An instance of a layer object.
-
Map.removeLayerByName(layername)¶ Remove a layer from the map given its name.
- Args:
layername(string): Name of the layer to remove. Usually the name of a layer is assigned using the optional parameternamein the methodsMap.addLayer()orMap.replaceLayer().
-
Map.clear()¶ Removes all layers of a Map object except the base layer.
-
Map.getLayerIds()¶ Returns the IDs of the layers of the Map object.
- Returns:
- A python list containing the IDs of the layers on the map.
-
Map.getLayerNames()¶ Returns the names of the layers of the Map object.
- Returns:
- A python list containing the names of the layers on the map.
-
Map.layersControl(flag=True)¶ Displays of hides the layers control on the map. When the layers control is displayed it allows the user to switch on and off the single layers of the map. The layers are divided in ‘base’ layers and ‘overlay’ layers. Only one ‘base’ layer can be visible at any time, while the ‘overlay’ layers can be freely switched on and off by the user. Inside the layer control each layer is displayed with its name (that can be set by passing the parameter name=… to the addLayer method) and is considered a ‘base’ or an ‘overlay’ layer by passing the parameter base=True or base=False to the addLayer method.
Args:
flag(boolean): if True the layers control is displayed on the map, if False it is hid. (optional, default = True).
Example:
map = Map(center=[45, 10], zoom=8, basemap=basemaps.CartoDB.DarkMatter)
map

map.clear()
map.addLayer(basemaps.Esri.WorldImagery, base=True)
map.addLayer(basemaps.Strava.All, name='Strava all activities')
map.addLayer(basemaps.Strava.Water)

map.layersControl(True)
-
Map.split(left, right)¶ Splits the map view in two parts visualizing a different layer on each of them. It’s a method that can be useful to easily compare two different ImageProcess instances.
- Args:
left(obj): layer to display on the left part of the splitted mapright(obj): layer to display on the right part of the splitted map
The two layers can be any of these: ImageProcess instances, procid of ImageProcessObjects (obtained by calling p.toLayer()), or basemaps
Example:
Create a map:
map = Map()
map.zoomToExtent(inter.search("ferno"))
map
Select a Sentinel-2 image and create a Natural color and a False color combination:
coll = inter.ImageCollection("S2")
coll = coll.filterOnGeoName("Ispra")
coll = coll.filterOnDay(2017,10,14)
coll = coll.filterOn("cloudcover", "<=", 50)
coll = coll.filterOn("jrc_filepath", "<>", "")
pNatural = coll.process().bands("B04","B03","B02",2)
pFalse   = coll.process().bands("B06","B04","B03",2)
Split the map and display the two color combinations:
map.split(pNatural,pFalse)
Split can also be created for basemaps:
map = Map()
map

map.split(basemaps.Esri.WorldImagery, basemaps.OpenTopoMap))
Measure Control
-
Map.measureControl(flag=True, color1='orange', color2='red')¶ Displays of hides the measure control on the map. When the measure control is displayed it allows the user to measure lines or polygon.
Args:
flag(boolean): if True the measure control is displayed on the map, if False it is hid (optional, default = True).color1(string): Color of the feature while it is digitized. Colors can be specified by names (e.g. ‘red’) or by their web values (e.g. ‘#ff0000’) (optional, default = ‘orange’).color2(string): Color of the feature after it has been digitized. Colors can be specified by names (e.g. ‘red’) or by their web values (e.g. ‘#ff0000’) (optional, default = ‘orange’).
Example:
map = Map(center=[45, 10], zoom=8, basemap=basemaps.CartoDB.DarkMatter)
map

map.measureControl(True, 'yellow', 'blue')

Draw Control
-
Map.drawPolygons(color='red')¶ Activates the interface for drawing polygons on the map. It is possible to assign any type of attribute to the features, just by calling
Map.setAttributeValues()before the new feature is digitized. Once digitizing is over, the created features can be added to a VectorLayer instance by callingVectorLayer.featuresAdd()or saved in shapefile format by callingsaveShapefile()global function. In both cases, what is returned byMap.getFeatures()method has to be passed as an argument to the exporting methods.Args:
color(string): Color of the digitized features. Colors can be specified by names (e.g. ‘red’) or by their web values (e.g. ‘#ff0000’) (optional, default = ‘orange’).
Example:
Create a map:
map = Map()
map
Activate the creation of polygonal features:
map.drawPolygons()
Set some attributes for the polygons that are going to be created:
map.setAttributeValues(type=1, name='abcd')
Then the digitizing can be activated by clicking on the button on the left side of the map.
At the end of the digitization process, the features can be saved in shapefile format (with their attributes):
inter.saveShapefile(map.getFeatures(),"polygons.shp")
Or added to a VectorLayer instance (in this case the attributes are lost and only the geometry is preserved):
v = inter.VectorLayer("wkt").opacity(128)

v.featuresAdd(map.getFeatures())

v.remove('default','all')
v.set('poly','fill','#ff0000')
v.set('line','stroke-width','5.0')

map.clear()
tlayer = map.addLayer(v.toLayer())
-
Map.drawPolylines(color='red')¶ Activates the interface for drawing polylines on the map. It is possible to assign any type of attribute to the features, just by calling
Map.setAttributeValues()before the new feature is digitized. Once digitizing is over, the created features can be added to a VectorLayer instance by callingVectorLayer.featuresAdd()or saved in shapefile format by callingsaveShapefile()global function. In both cases, what is returned byMap.getFeatures()method has to be passed as an argument to the exporting methods.Args:
color(string): Color of the digitized features. Colors can be specified by names (e.g. ‘red’) or by their web values (e.g. ‘#ff0000’) (optional, default = ‘orange’).
Example:
Create a map:
map = Map()
map
Activate the creation of polylines:
map.drawPolylines()
Set some attributes for the polylines that are going to be created:
map.setAttributeValues(type=2, name='fault line')
Then the digitizing can be activated by clicking on the button on the left side of the map.
At the end of the digitization process, the features can be saved in shapefile format (with their attributes):
inter.saveShapefile(map.getFeatures(),"polylines.shp")
Or added to a VectorLayer instance (in this case the attributes are lost and only the geometry is preserved):
v = inter.VectorLayer("wkt").opacity(128)

v.featuresAdd(map.getFeatures())

v.remove('default','all')
v.set('line','stroke','#ff0000')
v.set('line','stroke-width','5.0')

map.clear()
tlayer = map.addLayer(v.toLayer())
-
Map.drawPoints(color='red')¶ Activates the interface for drawing points on the map. It is possible to assign any type of attribute to the features, just by calling
Map.setAttributeValues()before the new feature is digitized. Once digitizing is over, the created features can be added to a VectorLayer instance by callingVectorLayer.featuresAdd()or saved in shapefile format by callingsaveShapefile()global function. In both cases, what is returned byMap.getFeatures()method has to be passed as an argument to the exporting methods.Args:
color(string): Color of the digitized features. Colors can be specified by names (e.g. ‘red’) or by their web values (e.g. ‘#ff0000’) (optional, default = ‘orange’).
Example:
Create a map:
map = Map()
map
Activate the creation of point features:
map.drawPoints()
Set some attributes for the points that are going to be created:
map.setAttributeValues(type=2, name='fault line')
Then the digitizing can be activated by clicking on the button on the left side of the map.
At the end of the digitization process, the features can be saved in shapefile format (with their attributes):
inter.saveShapefile(map.getFeatures(),"points.shp")
Or added to a VectorLayer instance (in this case the attributes are lost and only the geometry is preserved):
v = inter.VectorLayer("wkt").opacity(128)

v.featuresAdd(map.getFeatures())

v.set('point','stroke-width','1')
v.set('point','stroke','#FFFF02')
v.set('point','width','10')
v.set('point','height','10')
v.set('point','fill','#AA0000')
v.set('point','placement','point')
v.set('point','marker-type','ellipse')

map.clear()
tlayer = map.addLayer(v.toLayer())
-
Map.drawClose()¶ Closes any interface that was opened with a call to
Map.drawPolygons(),Map.drawPolylines()orMap.drawPoints(). All digitized features are deleted. Before calling this method, make sure you have saved the digitized feature to a VectorLayer instance or on disk in shapefile format by callingVectorLayer.featuresAdd()orsaveShapefile()methods.
-
Map.setAttributeValues(**kwargs)¶ Sets the name and value of the attributes to associate to the next features digitized using a call to
Map.drawPolygons(),Map.drawPolylines()orMap.drawPoints()Args:
dict(dictionary): any number of key/values.
Example:
Setting two attributes to be assigned to the features that are going to be digitized:
map.setAttributeValues(type=12, name='fault')
-
Map.getFeatures()¶ Returns a JSON string containing all the geometries and the attributes of the digitized feature. After calling
Map.drawPolygons(),Map.drawPolylines()orMap.drawPoints()and digitizing the new features, it is possible to pass them to an instance of VectorLayer object (callVectorLayer.featuresAdd()method) or to save them in shapefile format (callsaveShapefile()global function). An example of the JSON string returned is: “[{“wkt”: “POLYGON((-90.175781 56.298253, -72.597656 56.298253, -73.300781 48.727209, -92.285156 48.611122, -90.175781 56.298253))”}, {“type”: 6, “wkt”: “POLYGON((-14.765625 49.986552, 14.0625 51.433464, 17.402344 40.22083, -17.402344 38.453589, -14.765625 49.986552))”, “name”: “abcd”}]”
-
Map.getGeojson()¶ Returns a GEOJSON containing all the geometries and the attributes of the digitized feature.
Zoom and Extents
-
Map.getExtent()¶ Returns the current boundary of the Map object.
- Returns:
- A python list containing the lower-left and upper-right coordinates of the extent currently visualized on the map.
-
Map.zoomToExtent(extents)¶ Sets the center and zoom of the Map.
- Args:
extents(list containing latitude, longitude and zoom): Center and zoom level.
- Returns:
- A python list containing the extents currently visualized on the map.
- Example:
Set the center and the zoom level on a map object:
map = Map()
map.zoomToExtent([56,12, 9])
map
-
Map.zoomToImageExtent(imgProc)¶ Zooms to the extent of an
ImageProcessobject.- Args:
imgProc(ImageProcess): Instance of anImageProcessobject.
- Returns:
- A python list containing the extents currently visualized on the map.
Static methods
-
Map.printAvailableBasemaps()¶ Prints the list of all available basemaps. Integer numbers corresponding to each of the basemaps can be used in the creation of the Map object using the optional parameter
basemapas explained in the Notes section ofMap. This function is a static function and doesn’t need the creation of an instance to be called.