Working with vector layers
A set of predefined vector maps are available that can be used by creating a VectorLayer object and passing the name of the map. To print a list of all available vector layers the function listVectorLayers() can be called:
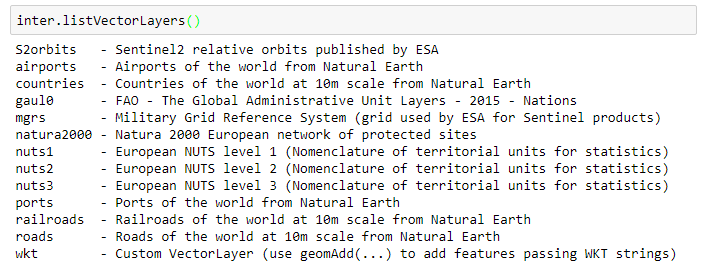
inter.listVectorLayers()
Here we will use the Nomenclature of Territorial Units for Statistics (NUTS), more in particular the national level, nuts1 We create the vector layer (v) and add it the map using Map.addLayer():
v = inter.VectorLayer("nuts1")
print(v.layers())
map.clear()
map.addLayer(v.toLayer())
To get the list of attributes of the dataset, you can use the VectorLayer’s function attributes().
For a specific attributeName, you can then query the distinct values using the function VectorLayer.distinct():
print v.attributes()
print v.distinct('ICC') # International Country Codes (ICC)
First we create an ImageProcess object from the “C03” collection:
p = inter.ImageCollection("C03").process()
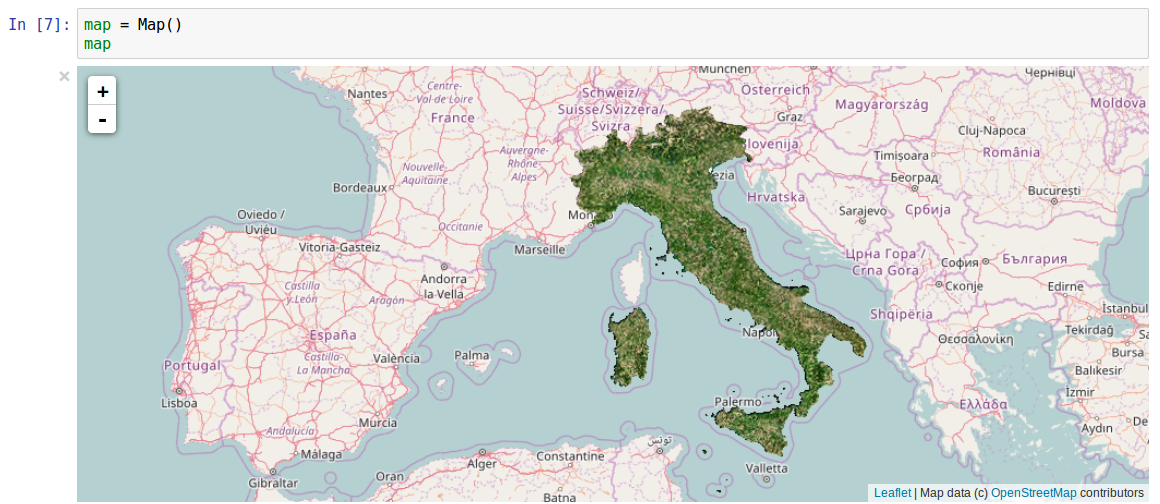
We will now use the “nuts1” VectorLayer to crop Italy (ICC=IT) from the “C03” ImageCollection.
The mask function will visualise all features that have an opaque fill. Transparent features will be hidden.
We first remove the symbology (see below) for all features using the function VectorLayer.remove() with the argument all.
Then we only fill the polygon that correspond to Italy in a non-transparent color (e.g., ‘white’). The resulting vector can then be used for masking the “C03” ImageProcess instance p:
map.clear()
v = inter.VectorLayer("nuts1")
v.remove('all')
country = "[ICC] = 'IT'"
v.set(country,'poly','fill','white')
pv = v.process()
p = p.mask(pv)
map.clear()
map.addLayer(p.toLayer())
Symbology
The symbology defines the visual appearance of a vector feature on the map. It is typically set according to some rule. For instance, you can set the symbology for ‘all’ features such that the polygons are filled in ‘red’ and have ‘grey’ lines:
v.set('all','poly','fill','red')
v.set('all','line','stroke','grey')
Alternatively, you can build rules for different features. Rules are built on top of each other, so you might want to start from a clean symbology: v.remove(‘all’) We now define different rules for specific features, specifying some attribute (instead of ‘all’):
v.remove('all')
v.set('all','line','stroke-width','0.5')
v.set('all','line','stroke','#000077')
v.set("[ICC] = 'IT'",'poly','fill','#00888877')
v.set("[ICC] = 'IT'",'line','stroke','#ffff00')
v.set("[ICC] = 'IT'",'line','stroke-width','2')
v.set("[ICC] = 'FR'",'poly','fill','#99000055')
v.set("[ICC] = 'FR'",'line','stroke-width','1.5')
v.set("[ICC] = 'FR'",'line','stroke','#ff00ff')
map.clear()
tlayervector = map.addLayer(v.toLayer())
Customising symbols for each feature can be cumbersome. We can automatically define symbols via legend functions that are depending on the feature characteristics.
Three types of legend are supported:
- single: for assigning a single symbol legend to all features
- categories: for classifying categorical feature attributes
- graduated: for classifying continuous feature attributes
Create a single legend:
v = inter.VectorLayer("nuts1").opacity(255)
v.legendSet('line','stroke','#000000')
v.legendSet('line','stroke-width','0.25')
v.legendSingle("#ff0000")#ff0000 corresponds to 'red'
map.clear()
tlayer = map.addLayer(v.toLayer())
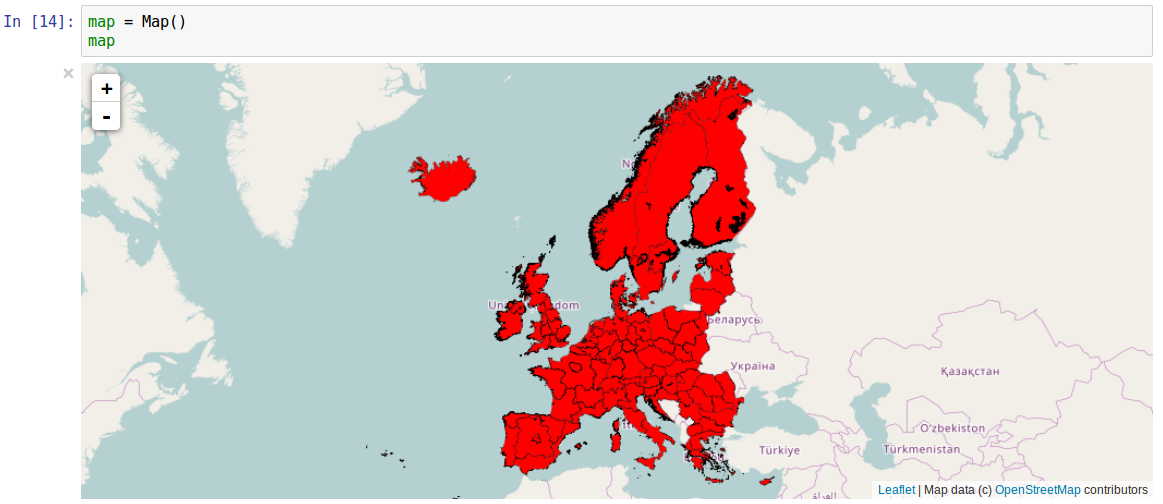
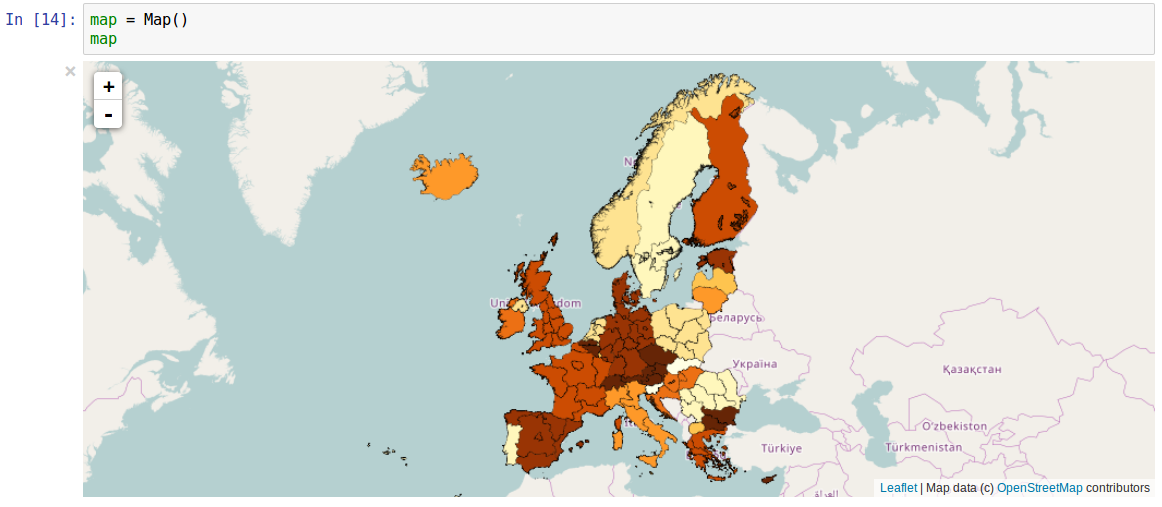
Create a legend on all distinct values of an alphanumeric attribute (ICC which contains the country code for each polygon) and use different color schemes:
v = inter.VectorLayer("nuts1").opacity(255)
v.legendSet('line','stroke','#000000')
v.legendSet('line','stroke-width','0.5')
v.colorScheme("YlOrBr_discrete")
#v.colorScheme("random",10)
v.legendCategories("ICC")
map.clear()
tlayer = map.addLayer(v.toLayer())
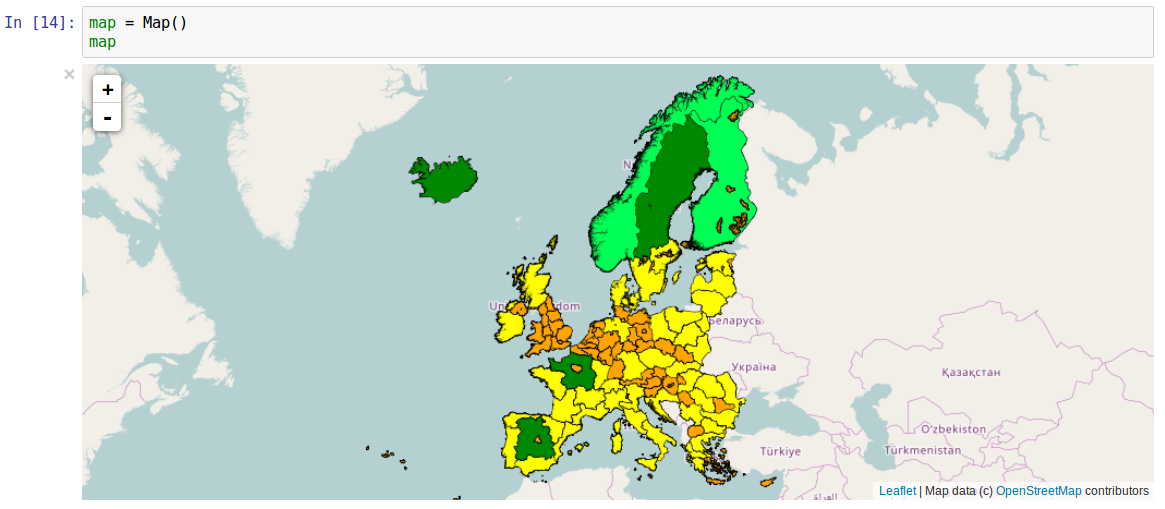
Create a graduated color legend based on a numeric attribute (in this case the area of polygons):
v = inter.VectorLayer("nuts1").opacity(255)
v.legendSet('line','stroke','#000000')
v.legendSet('line','stroke-width','1.0')
colors = ["Orange", "Yellow", "#008800", "#00ff55"]
v.colorCustom(colors)
#v.colorScheme("YlGnBu_soft")
v.legendGraduated("Shape_Area","natural",4)
#v.legendGraduated("Shape_Area","pretty",15)
#v.legendGraduated("Shape_Area","stddev",10)
#v.legendCategories("ICC")
map.clear()
tlayer = map.addLayer(v.toLayer())
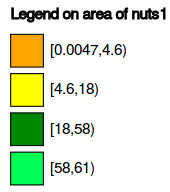
Display legend of the VectorLayer in SVG format:
inter.legend(v,"Legend on area of nuts1",1)
Sentinel-2 Military Grid Reference System (MGRS) vector dataset
We create a new VectorLayer object, loading the MGRS vector dataset (“mgrs”) and set the symbology for a single feature (attribute:”[Name]=‘33TUH’”), using:
- line stroke is ‘black’
- polygon fill color is ‘00ff0044’ (the last two digits 44 represent the opaqueness of the fill color)
The source file of the Sentinel-2 MGRS can be found in kml format
The layer is then added to the map:
v = inter.VectorLayer("mgrs").opacity(255)
v.remove('all')
v.set("[Name] = '32TMR'",'line','stroke','#000000')
v.set("[Name] = '32TMR'",'poly','fill','#00ff0044')
map.clear()
tlayer = map.addLayer(v.toLayer())
To search the vector layer, we can use SQL syntax to filter features and zoom on the result:
res = v.search("Name = '32TMR'")
b = map.zoomToExtent(res)

Creating your custom VectorLayer
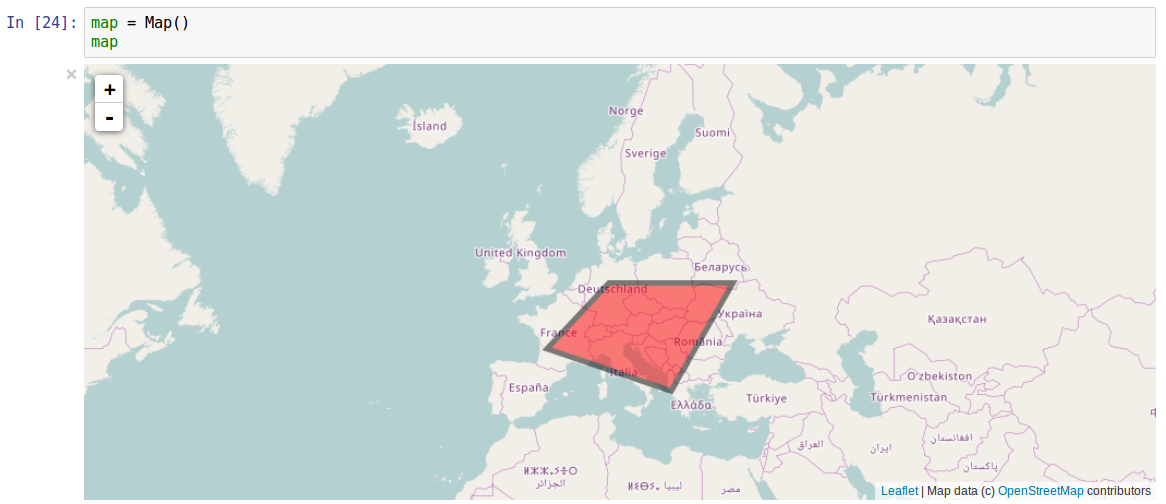
You can create your custom Vectorlayer from strings in Well-Known-Text format:
v = inter.VectorLayer("wkt").opacity(128)
v.geomAdd("POLYGON ((20 40, 0 45, 10 52, 30 52, 20 40))")

v.remove('all')
v.set('poly','fill','#ff0000')
v.set('line','stroke-width','5.0')

#v.printXML()
#v.printLayer()

map.clear()
tlayer = map.addLayer(v.toLayer())